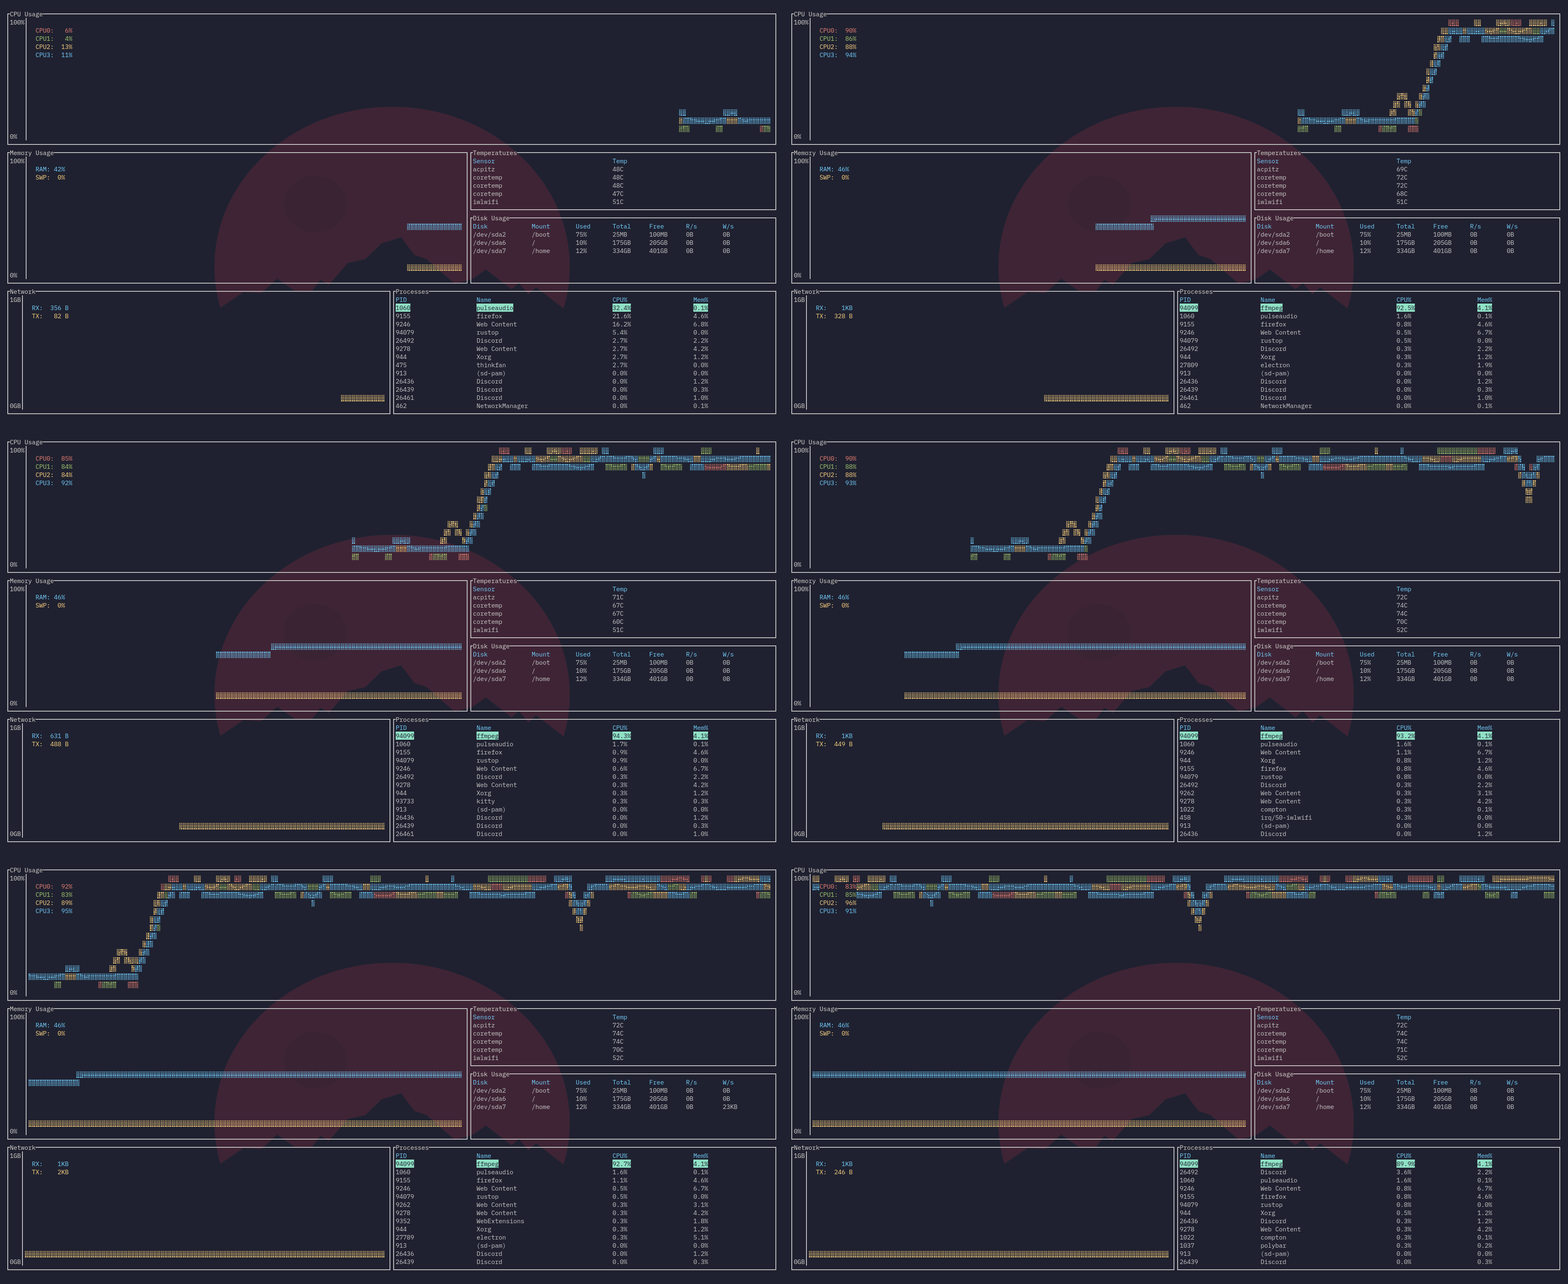
bottom
A top clone, written in Rust. Inspired by both gtop and gotop
 Note that the background you see is not part of the app, that's just because I use a slightly transparent background
Installation
Linux
You can install by cloning and using cargo build --release, or download the pre-compiled binary in Releases. Note this needs the nightly toolchain if you are building.
Windows
This is still in development.
MacOS
Currently, I'm unable to test on MacOS, so I'm not sure how well this will work, if at all. I'll try to source MacOS hardware to test this application.
Usage
Command line options
-
-h,--helpto show the help screen and exit (basically has all of the below CLI option info). -
-a,--avgcpuenables showing the average CPU usage on rustop -
-c,--celsiusdisplays the temperature type in Celsius. This is the default. -
-f,--fahrenheitdisplays the temperature type in Fahrenheit. This is the default. -
-k,--kelvindisplays the temperature type in Kelvin. This is the default. -
-v,--versiondisplays the version number and exits. -
-r <RATE>,--rate <RATE>will set the refresh rate in milliseconds. Pick a range from 250ms toUINT_MAX. Defaults to 1000ms, and higher values may take more resources due to more frequent polling of data, and may be less accurate in some circumstances.
Keybinds (some may not be available on certain operating systems)
General
-
q,Esc, orCtrl-Cto quit. -
Up/k,Down/j,Left/h,Right/lto navigate between panels. This currently doesn't have much functionality but will change in the future.
Processes Panel
-
ddto kill the selected process (currently only on Linux) - I would highly recommend you to be careful using this, lest you accidentally kill the wrong process. -
cto sort by CPU usage. Sorts in descending order by default. Press again to reverse sorting order. -
mto sort by memory usage. Sorts in descending order by default. Press again to reverse sorting order. -
pto sort by PID. Sorts in ascending order by default. Press again to reverse sorting order. -
nto sort by process name. Sorts in ascending order by default. Press again to reverse sorting order.
Mouse Actions
- Scrolling currently only scrolls through the list if you are on the Processes panel. This will change in the future.
Regarding Process Use Percentage (on Linux)
I cannot guarantee whether they are 100% accurate. I'm using a technique I found online which seems to be a better indicator of process use percentage at the current time, rather than pulling from, say, ps (which is average CPU usage over the entire lifespan of the process). I found the options from the library I used to get other data (heim) to be a bit too inaccurate in my testing.
For reference, the formula I am using to calculate CPU process usage is along the lines of:
let idle = idle + iowait;
let non_idle = user + nice + system + irq + softirq + steal + guest;

let total = idle + non_idle;
let prev_total = prev_idle + prev_non_idle; // Both of these values are calculated using the same formula from the previous polling

let total_delta : f64 = total - prev_total;
let idle_delta : f64 = idle - prev_idle;

let final_delta : f64 = total_delta - idle_delta;

//...

// Get utime and stime from reading /proc/<PID>/stat
let after_proc_val = utime + stime;
(after_proc_val - before_proc_val) / cpu_usage * 100_f64; //This gives your use percentage.  before_proc_val comes from the previous polling
Any suggestions on more accurate data is welcome! Note all other fields should be accurate.
Thanks
-
As mentioned, this project is very much inspired by both gotop and gtop .
-
This application was written with the following libraries:
Why
I was looking to try writing more things in Rust, and I love the gotop tool. And thus, this project was born.