bottom
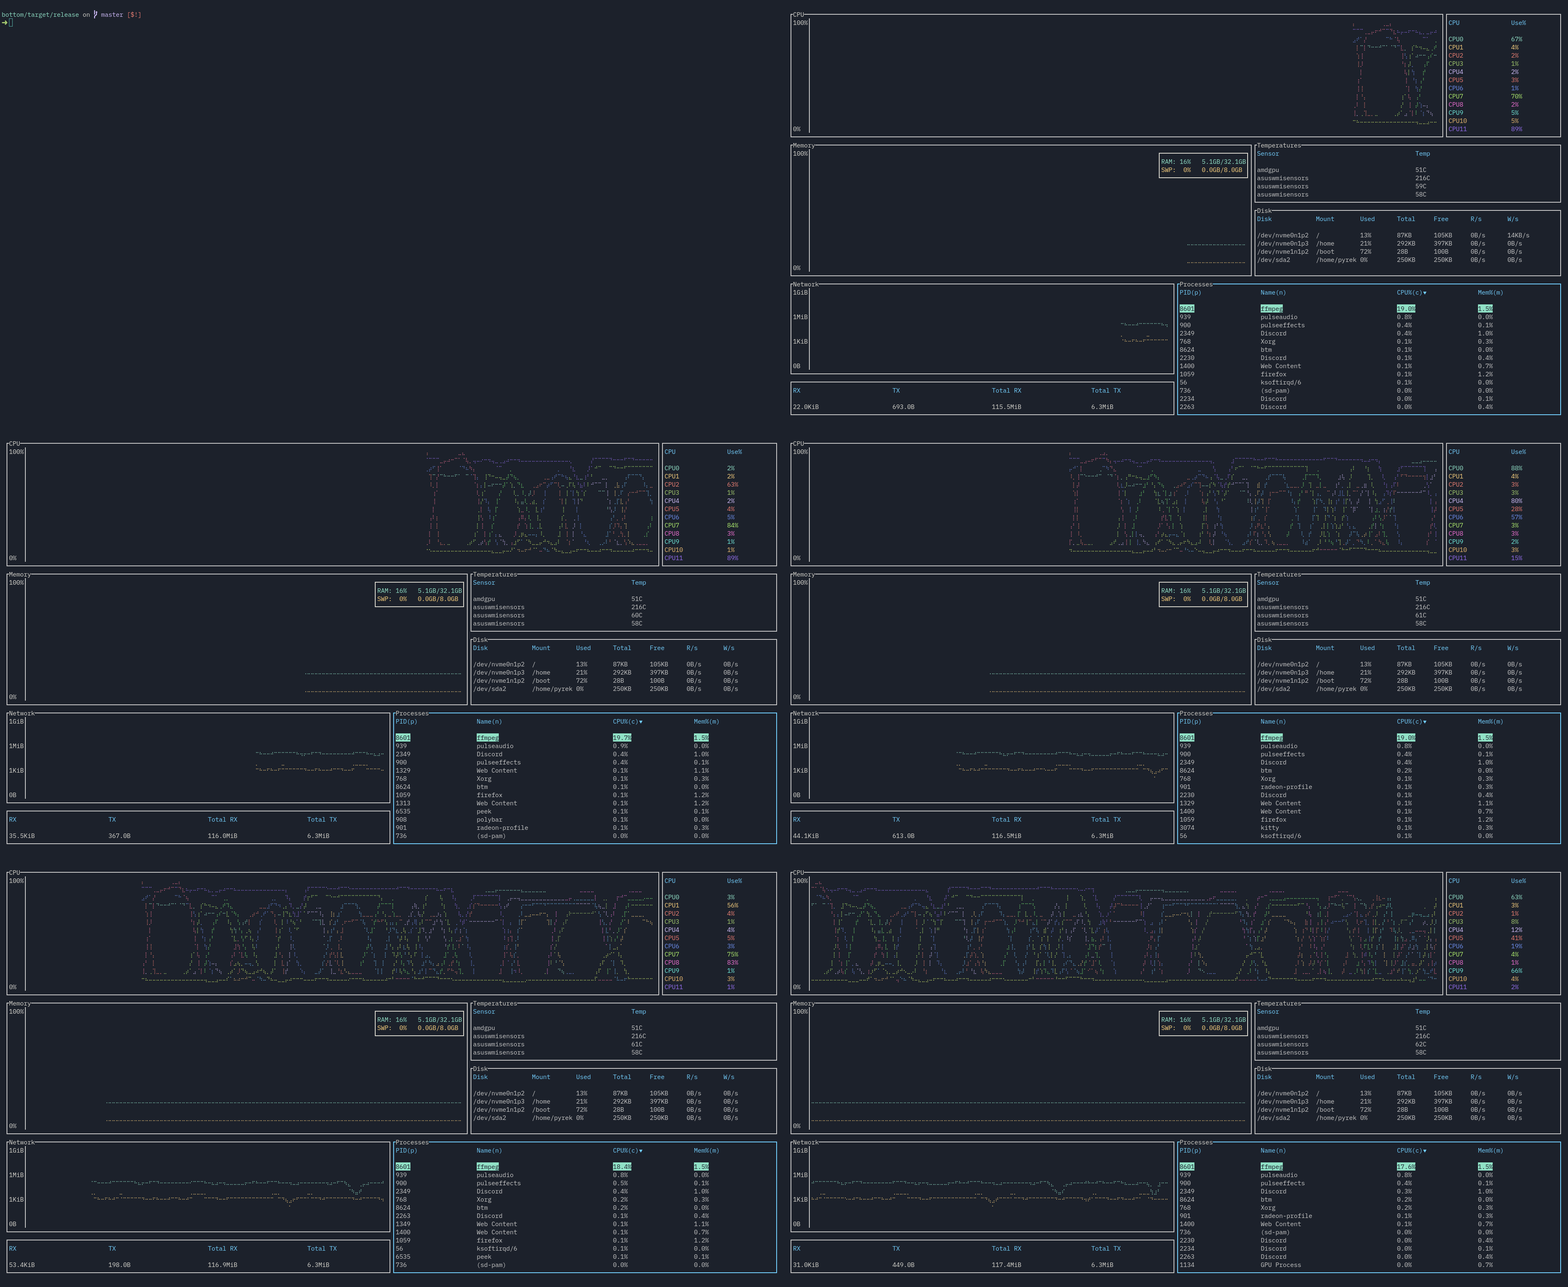
A graphical top clone, written in Rust. Inspired by both gtop and gotop
Installation
Linux
You can install by cloning and using cargo build --release, or download the pre-compiled binary in Releases.
Windows
You can currently install by cloning and building yourself using cargo build --release. You may need to install a font like FreeMono and use a terminal like cmder for font support to work properly, unfortunately.
macOS
macOS support will hopefully come soonTM.
Compatibility
The compatibility of each widget and operating systems are, as of version 0.1.0, as follows:
| OS/Widget | CPU | Memory | Disks | Temperature | Processes | Networks |
|---|---|---|---|---|---|---|
| Linux | ✓ | ✓ | ✓ | ✓ | ✓ | ✓ |
| Windows | ✓ | ✓ | ✓ | Currently not working | ✓ | Partially supported (total RX/TX unavailable) |
| macOS | Untested | Untested | Untested | Untested | Untested | Untested |
Usage
Command line options
-
-h,--helpshows the help screen and exits. -
-a,--avgcpuenables also showing the average CPU usage in addition to per-core CPU usage. -
-m,--dot-markeruses a dot marker instead of the default braille marker. -
-c,--celsiusdisplays the temperature type in Celsius. This is the default. -
-f,--fahrenheitdisplays the temperature type in Fahrenheit. -
-k,--kelvindisplays the temperature type in Kelvin. -
-v,--versiondisplays the version number and exits. -
-d,--debugenables debug logging. -
-r <RATE>,--rate <RATE>will set the refresh rate in milliseconds. Lowest it can go is 250ms, the highest it can go is 2128 - 1. Defaults to 1000ms, and lower values may take more resources due to more frequent polling of data, and may be less accurate in some circumstances. -
-l,--left_legendwill move external table legends to the left side rather than the right side. Right side is default. -
-u,--current_usagewill make a process' CPU usage be based on the current total CPU usage, rather than assuming 100% CPU usage. Only affects Linux for now.
Keybindings
General
-
q,Ctrl-cto quit. -
Ctrl-rto reset the screen and reset all collected data. -
fto freeze the screen from updating with new data. Pressfagain to unfreeze. Note that monitoring will still continue in the background. -
Ctrl+Up/k,Ctrl+Down/j,Ctrl+Left/h,Ctrl+Right/lto navigate between panels. -
UpandDownscrolls through the list if the panel is a table (Temperature, Disks, Processes). -
Escto close a dialog window. -
?to get a help screen explaining the controls. Note all controls exceptEscto close the dialog will be disabled while this is open.
Processes, temperature, and disk panels
-
ddto kill the selected process -
cto sort by CPU usage. Sorts in descending order by default. Press again to reverse sorting order. -
mto sort by memory usage. Sorts in descending order by default. Press again to reverse sorting order. -
pto sort by PID. Sorts in ascending order by default. Press again to reverse sorting order. -
nto sort by process name. Sorts in ascending order by default. Press again to reverse sorting order. -
ggto jump to the first entry of the current table. -
G(Shift+g) to jump to the last entry of the current table.
Mouse actions
- Scrolling with the mouse will go through lists/tables right now, similar to using the up/down arrow keys.

