# Icinga 2 Addons
## Graphing
### Graphite
[Graphite](https://graphite.readthedocs.org/en/latest/) is a time-series database
storing collected metrics and making them available through restful apis
and web interfaces.
Graphite consists of 3 software components:
* carbon -- a Twisted daemon that listens for time-series data
* whisper -- a simple database library for storing time-series data (similar in design to RRD)
* graphite webapp -- a Django webapp that renders graphs on-demand using Cairo
You need to install Graphite first, then proceed with configuring it in Icinga 2.
Use the [GraphiteWriter](14-features.md#graphite-carbon-cache-writer) feature
for sending real-time metrics from Icinga 2 to Graphite.
```
# icinga2 feature enable graphite
```
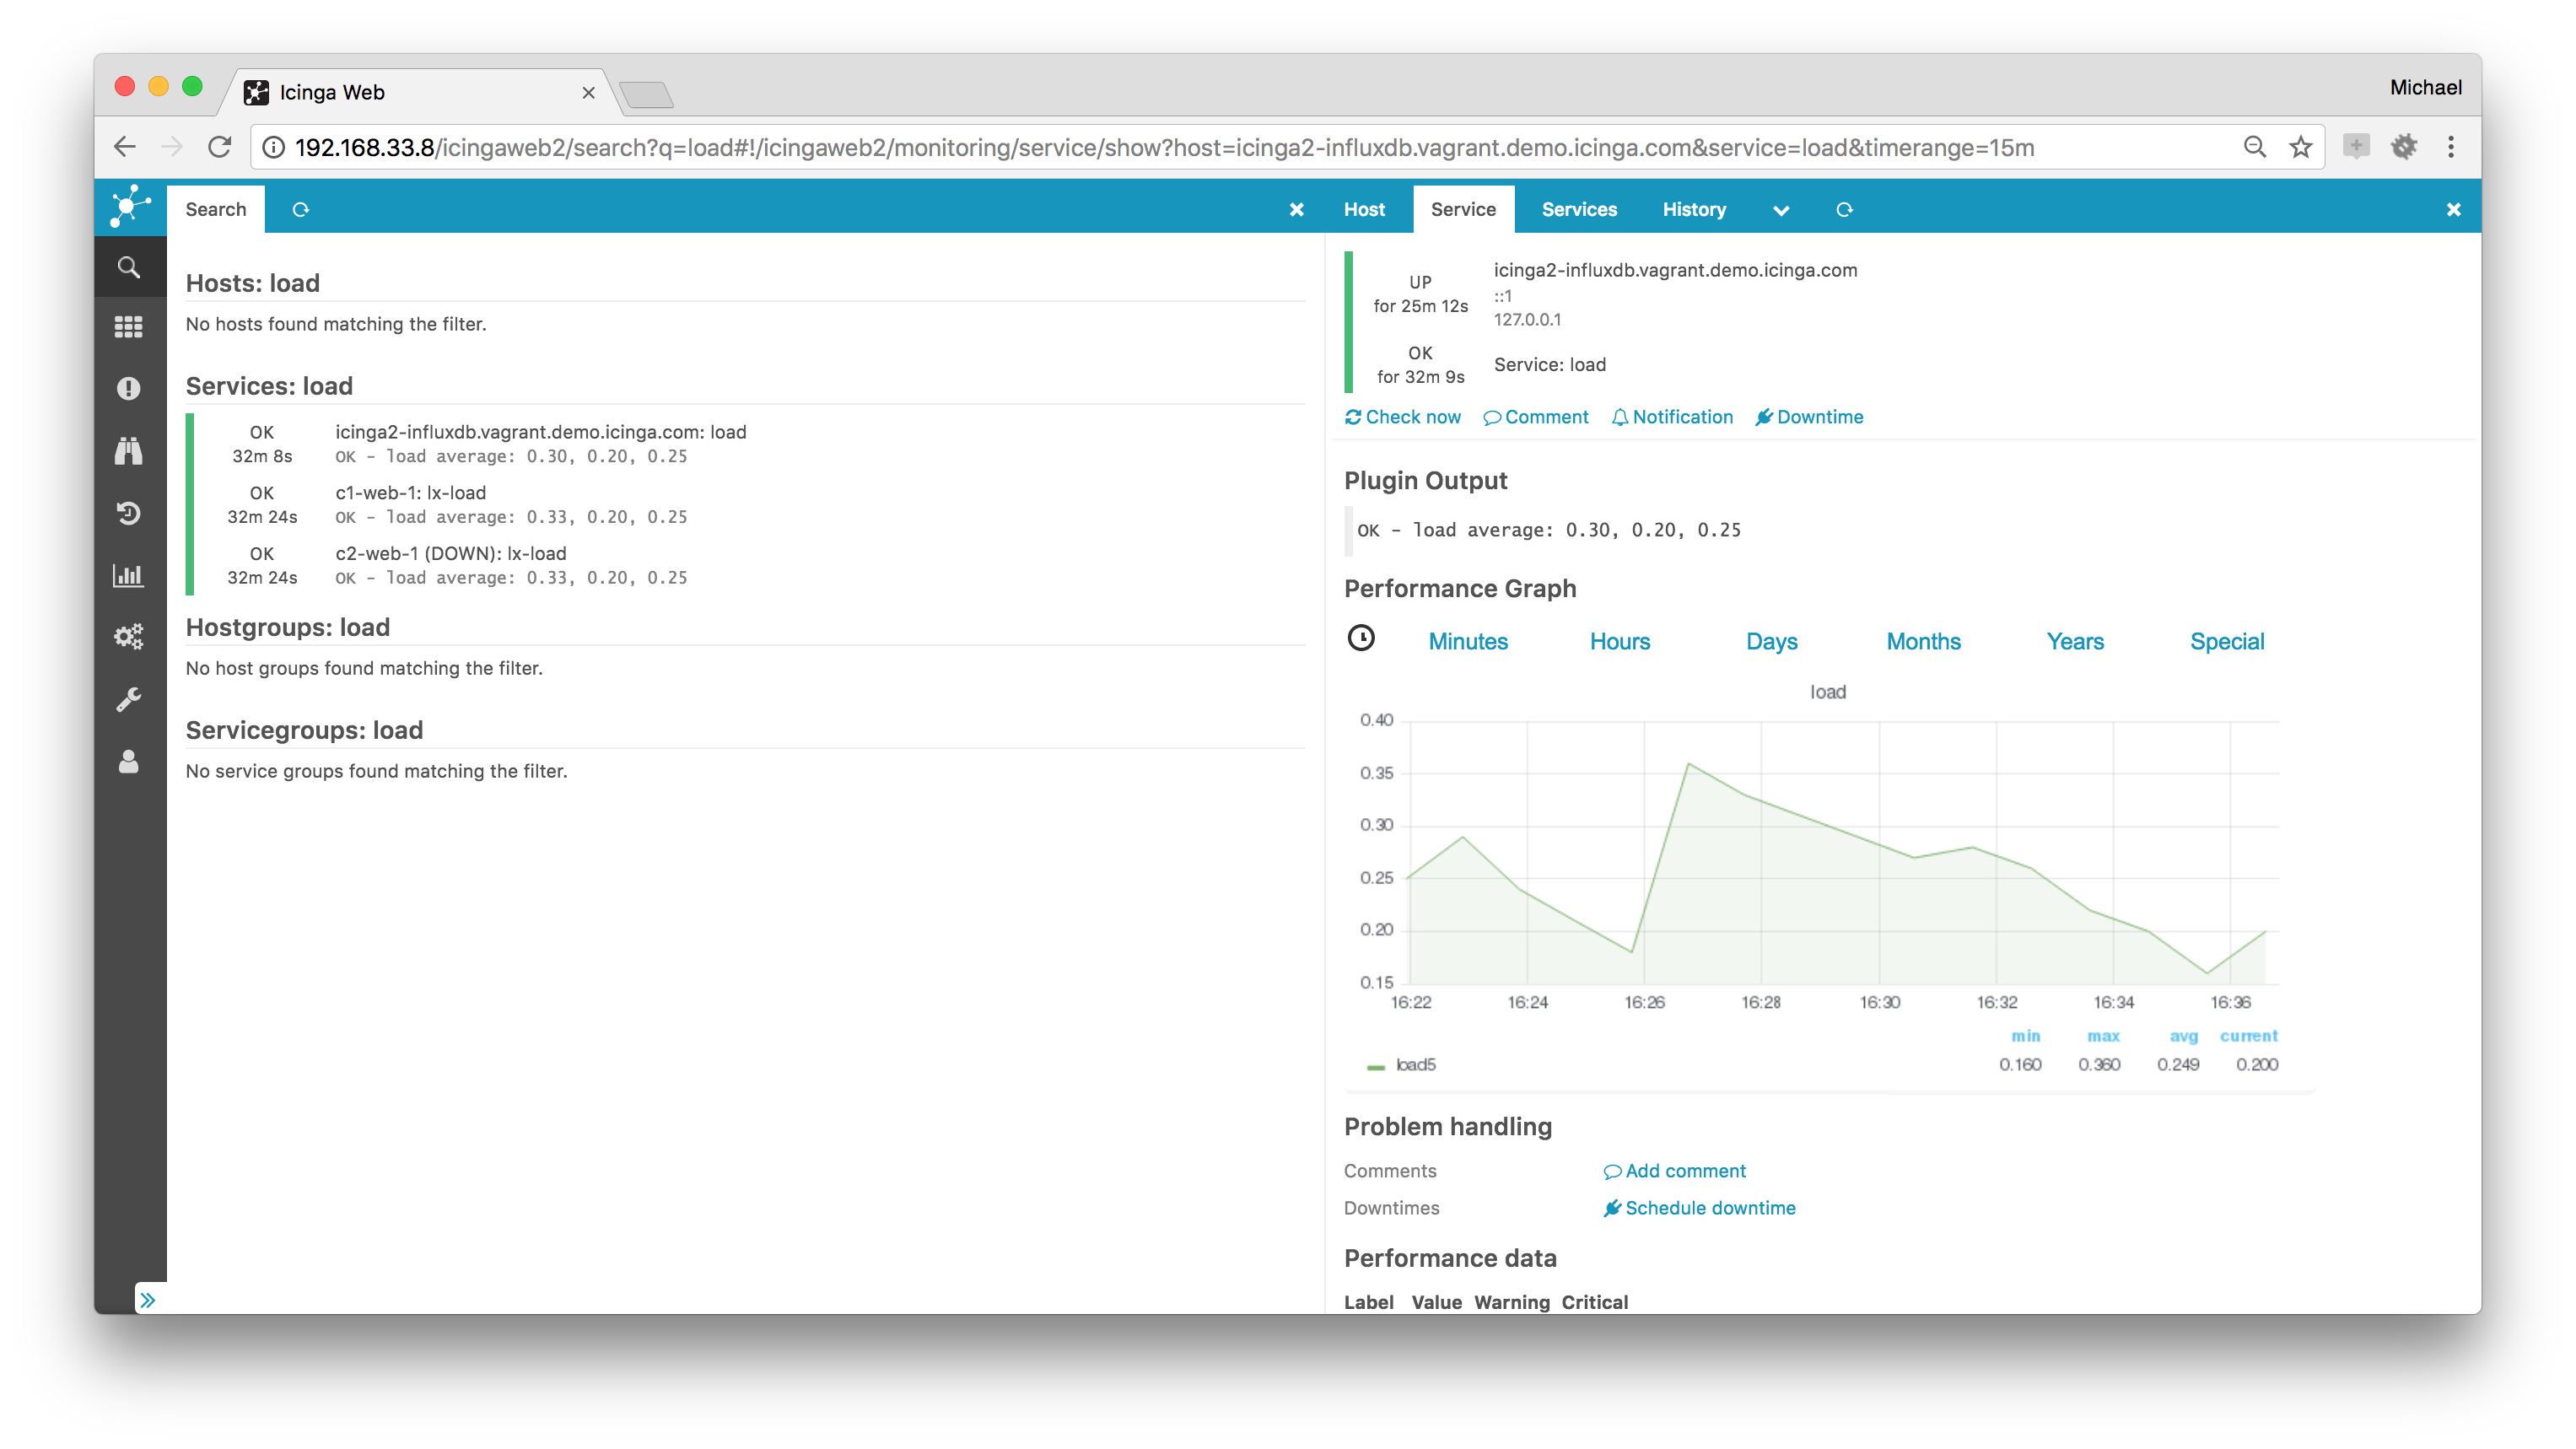
A popular alternative frontend for Graphite is for example [Grafana](https://grafana.org).
Integration in Icinga Web 2 is possible by installing the official [graphite module](https://icinga.com/docs/graphite/latest/).

### InfluxDB
[InfluxDB](https://influxdb.com) is a time series, metrics, and analytics database.
It’s written in Go and has no external dependencies.
Use the [InfluxdbWriter](14-features.md#influxdb-writer) feature
for sending real-time metrics from Icinga 2 to InfluxDB.
```
# icinga2 feature enable influxdb
```
A popular frontend for InfluxDB is for example [Grafana](https://grafana.org).
Integration in Icinga Web 2 is possible by installing the community [Grafana module](https://github.com/Mikesch-mp/icingaweb2-module-grafana).

### PNP
[PNP](https://www.pnp4nagios.org) is a graphing addon.
[PNP](https://www.pnp4nagios.org) is an addon which adds a graphical representation of the performance data collected
by the monitoring plugins. The data is stored as rrd (round robin database) files.
Use your distribution's package manager to install the `pnp4nagios` package.
If you're planning to use it, configure it to use the
[bulk mode with npcd and npcdmod](https://docs.pnp4nagios.org/pnp-0.6/modes#bulk_mode_with_npcd_and_npcdmod)
in combination with Icinga 2's [PerfdataWriter](14-features.md#writing-performance-data-files). NPCD collects the performance
data files which Icinga 2 generates.
Enable performance data writer in icinga 2
```
# icinga2 feature enable perfdata
```
Configure npcd to use the performance data created by Icinga 2:
```
vim /etc/pnp4nagios/npcd.cfg
```
Set `perfdata_spool_dir = /var/spool/icinga2/perfdata` and restart the `npcd` daemon.
There's also an Icinga Web 2 module for direct PNP graph integration
available at [Icinga Exchange](https://exchange.icinga.com/icinga/PNP).
## Visualization
### Maps
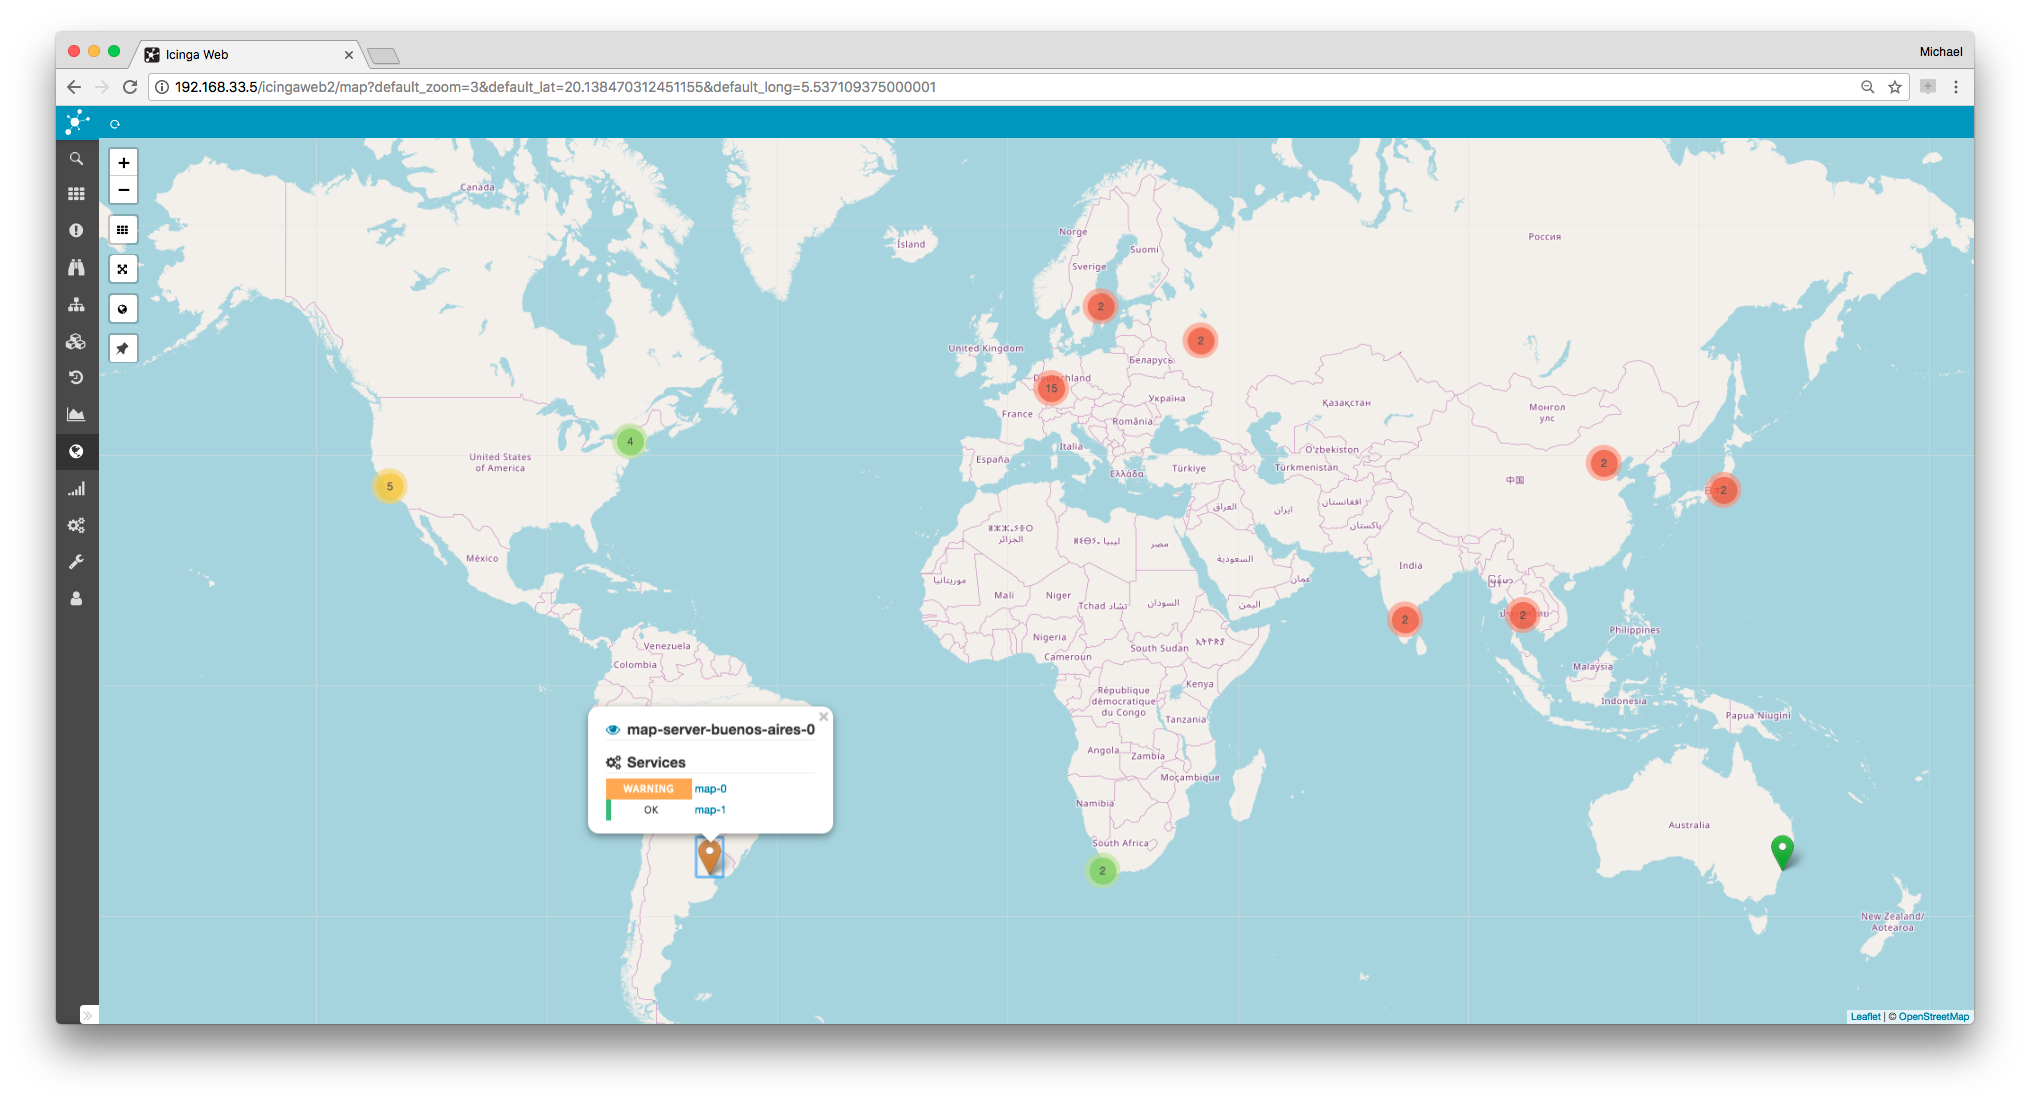
This community module displays host objects as markers on openstreetmap in Icinga Web 2.
It uses the data provided by the monitoring module and as such the [DB IDO](14-features.md#db-ido)
from Icinga 2.
If you configure multiple hosts with the same coordinates, i.e. servers in a datacenter, a clustered view is rendered.
Check the [Map module docs](https://github.com/nbuchwitz/icingaweb2-module-map) for more details on
installation, configuration and integration.

### Dashing Dashboard
The [Icinga 2 dashboard](https://github.com/dnsmichi/dashing-icinga2) is built
on top of Dashing and uses the [REST API](12-icinga2-api.md#icinga2-api) to visualize what's going
on with your monitoring. It combines several popular widgets and provides development
instructions for your own implementation.
The dashboard also allows to embed the [Icinga Web 2](https://icinga.com/products/icinga-web-2/)
host and service problem lists as Iframe.

### Business Process
Create top-level views of your applications in a graphical editor.
Rules express dependencies between existing hosts and services and
let you alert on application level. Business processes are displayed
in a tree or list overview and can be added to any dashboard.

### NagVis
By using the [DB IDO](14-features.md#db-ido) feature
you can create your own network maps
based on your monitoring configuration and status data using [NagVis](https://www.nagvis.org).
The configuration in nagvis.ini.php should look like this for Livestatus for example:
```
[backend_live_1]
backendtype="mklivestatus"
socket="unix:/var/run/icinga2/cmd/livestatus"
```
If you are planning an integration into Icinga Web 2, look at [this module](https://github.com/Icinga/icingaweb2-module-nagvis).
### Icinga Reporting
By enabling the [DB IDO](14-features.md#db-ido) feature you can use the
[Icinga Reporting package](https://icinga.com/docs/icinga1/latest/en/reporting.html).
### Thruk
[Thruk](https://www.thruk.org) is an alternative web interface which can be used with Icinga 2
and the [Livestatus](14-features.md#setting-up-livestatus) feature.
## Log Monitoring
Using [Logstash](https://www.elastic.co/guide/en/logstash/current/introduction.html) or
[Graylog](https://www.graylog.org) in your infrastructure and correlate events with your monitoring
is even simpler these days.
* Use the `GelfWriter` feature to write Icinga 2's check and notification events to Graylog or Logstash.
* Configure the logstash `nagios` output to send passive traps to Icinga 2 using the external command pipe.
* Execute a plugin to check Graylog alert streams.
More details can be found in [this blog post](https://icinga.com/2014/12/02/team-icinga-at-osmc-2014/).
## Notification Scripts and Interfaces
There's a variety of resources available, for example different notification scripts such as:
* E-Mail ([examples](03-monitoring-basics.md#alert-notifications) provided)
* SMS
* Pager (XMPP, etc.)
* Twitter
* IRC
* Ticket systems
* etc.
Additionally external services can be [integrated with Icinga 2](https://icinga.com/products/integrations/):
* [Pagerduty](https://icinga.com/products/integrations/pagerduty/)
* [VictorOps](https://icinga.com/products/integrations/victorops/)
* [StackStorm](https://icinga.com/products/integrations/stackstorm/)
More information can be found on the [Icinga Website](https://icinga.com/).
## Configuration Management Tools
If you require your favourite configuration tool to export the Icinga 2 configuration, please get in
touch with their developers. The Icinga project does not provide a configuration web interface
yet. Follow the [Icinga Blog](https://icinga.com/blog/) for updates on this topic.
If you're looking for puppet manifests, chef cookbooks, ansible recipes, etc. -- we're happy
to integrate them upstream, so please get in touch with the [Icinga team](https://icinga.com/community/).
These tools are currently in development and require feedback and tests:
* [Ansible Roles](https://github.com/Icinga/icinga2-ansible)
* [Puppet Module](https://github.com/Icinga/puppet-icinga2)
* [Chef Cookbook](https://github.com/Icinga/chef-icinga2)
## More Addon Integration Hints
### PNP Action Url
They work in a similar fashion for Icinga 2 and are used for 1.x web interfaces (Icinga Web 2 doesn't require
the action url attribute in its own module).
```
template Host "pnp-hst" {
action_url = "/pnp4nagios/graph?host=$HOSTNAME$"
}
template Service "pnp-svc" {
action_url = "/pnp4nagios/graph?host=$HOSTNAME$&srv=$SERVICEDESC$"
}
```