

The agents collect information. The public key of the machine to be monitored needs to be copied onto Pandora and the agent executed. Pandora's server starts now receiving and processing the data collected by the agent. The data collected from the agents are called "modules".
The value of each module it is the value of one monitored variable. The agent must be activated in Pandora's server and a group assigned to the agent. The data starts then been consolidated in the database and can be accessed.
The user can:
Groups are added in "Manage Profiles" > "Manage Groups", Administration menu.
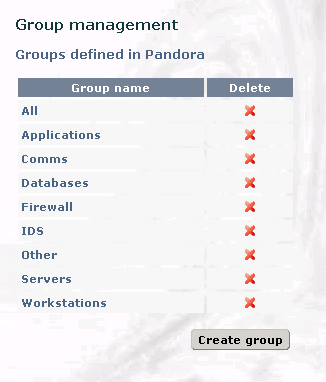
There are nine default groups on this screen.
A group is added by clicking "Create group" and assigning a name to it.
A group is deleted by clicking the delete icon  in the right hand side of each group.
Before an agent is added, the public key of the machine to be monitored needs to be copied. The agent is then executed, and added through the web console. The data starts now being consolidated in the Database and can be accessed.
An agent is added in "Manage Agents" > "Create agent" in the Administration menu.

To add a new agent the following parameters must be configured:
- Learning mode: All the modules sent by the agent are accepted. They are automatically defined by the system. It is recommended to activate the agents in this mode and change it once the user is familiar with the system.
- Normal mode: The modules in this mode must be configured manually. The self – definition of the modules is not allowed in this mode.
Pandora's agents use the operating system own commands to monitor a device. Pandora's server will store and process the output generated by those commands. The commandos are called "modules".
If the agent had been added in "normal mode", the modules to be monitored should have been assigned. Those modules must be configured in the agent configuration file.
The modules to be processed by Pandora's server are assigned in the "Manage Agents" option, Administration menu. A list with all the agents in Pandora will be shown here.
You'll get a form with all the agent's settings when the agent name is clicked. In the same screen there is a section to assign modules.
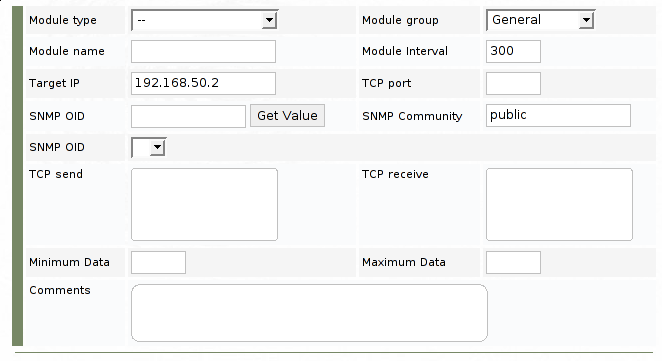
The following fields must be filled to create a module:
- generic_data, Integer data type
- generic_data_inc, Incremental integer data type
- generic_data_proc, Boolean data type: 0 False, >0 True.
- generic_data_string, Alphanumeric data type (text string, max. 255 characters).
All the modules to be monitored by an agent can be reviewed by accessing the agent in the "Manage Agents" option, Administration menu.

In this screen the modules can be:


However, the type of data of the module can't be modified.
An alert is Pandora's reaction to an out of range module value. The Alert can consist in sending and e-mail or SMS to the administrator, sending a SNMP trap, write the incident into the system syslog or Pandora log file, etc. And basically anything that can be triggered by a script configured in Pandora's Operating System.
The existing Alerts are accessed by clicking on the "Manage Alerts" option, Administration menu.
There are 6 default types of Alerts:

An Alert is deleted by clicking on the delete icon  placed on the right hand side of the Alert. A new customised Alert can be created clicking in "Create Alert".
The values "_field1_", "_field2_" and "_field3_" in the customised Alerts are used to build the command line that the machine where Pandora resides will execute – if there were several servers, the one in Master mode.

When a new Alert is created the following field must be filled in:
In 'Command' data field these variables are used to build the command line that the machine where Pandora resides will execute – if there were several servers, the one in Master mode, replacing at runtime:
_field1_: Field #1, usually assigned as username, e-mail destination or single identification for this event_field2_: Field #2, usually assigned as short description of events, as subject line in e-mail_field3_: Field #3, a full text explanation for the event_agent_: Agent name_timestamp_: A standard representation of date and time. Replaced automatically when the event has been fired_data_: The data value that triggered the alertThe next step after an Agent has been added, its modules have been configurated and the alerts have been defined, it is time to assign those Alerts to the agent.
This is done by clicking on the Agent to be configured on the "Manage Agents" option, Administration menu. The Alert association form is placed at the bottom of that page.
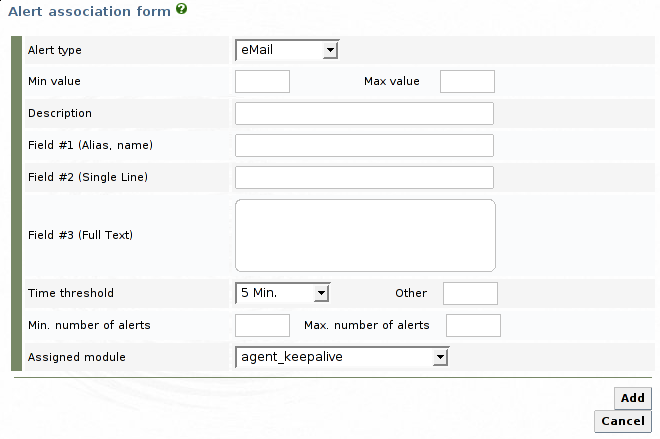
To assign an Alert the next fields must be filled in:
All the alerts of an agent can be seen through "Manage Agents" in the Adminitration menu and selecting the agent.
It might happen that the user finds that modules and alerts configured for an agent would be repeated in a new agent.
In order to simplify the administrator's job Pandora offers the option of copying modules and alerts defined in an agent to be assigned to another.
The screen is accessed through "Manage Agents">"Manage Config.", in the Administration menu:

The Source Agent menu permits the selection of the agent where the needed modules and/or alerts reside. The "Get Info" button shows the modules for that agent in the Modules list box.
The copy process is performed to copy the module and/or alert configuration from the selected source agents to the selected destination agents. Several agents can be selected, pressing CTRL and the mouse right button simultaneously. The two tick boxes at the top of the form will be used to specify if the configuration to copy is from modules and/or from alerts.
The delete process is performed to delete the configuration of the destination agents, in the multiple selection list box. Several agents can be selected at a time, and the tick boxes at the top of the form indicate whether it is the modules or the alerts configuration what is to be deleted. The application will prompt to confirm the deletion, as once deletion is performed, the data associated to them will also be deleted.
Once you have configured your groups and agents, you can see the status of the groups of agents through "View Agents", in the Operation Menu.
If you pass the mouse over any group image, you'll see the number of agents of that group as well the number of monitors, organized by status.
By pressing the icon  at the right of any group image, you will update the info of that group.
When the agents start the data transmission to the server, and it is added in the Web console, Pandora processes and inserts the data in the Database. The data are consolidated and can be accessed from the Web console, either as row data or as graphs.
All the Agents can be accessed from the Operation menu.
You can view the agents in groups by clicking "View agents". From here the status of the agents can be quickly reviewed thanks to a simple system coloured circles and bulbs that appear when the user pass the mouse on a group.

To view all the Agents of the group just click in the icon of the group.
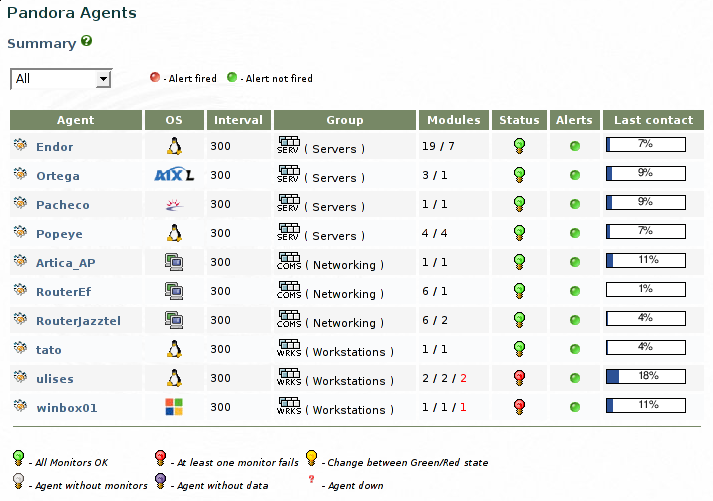
The list of agents shows all the relevant the information in the following columns:
Agent: Shows the agent's name.
SO: Displays an icon that represents the Operating System.
Interval: Shows the time interval (seconds) in which the agent sends data to the server.
Group: This is the group the agent belongs to.
Modules: Under normal circumstances this field shows the values representing the number of modules and the number of monitors, both in black. If the status of a monitor changes to "incorrect", one additional number is shown: the number of modules, the number of monitors and the number of monitors with "incorrect" status, all in black save the last one.
Status: Shows the "general" status of the agent through the following icons:
 All the monitors OK. It's the ideal status.
 No defined monitors. Sometimes nothing is monitored
that could be right or wrong, and only numeric or text data is reported.
 At least one of the monitors is failing. Usually we
want to avoid this, and keep our systems in a healthy green colour.
 The agent doesn't have any data. New agents with an empty data
package can have this status.
 Colour shifting from green to red. This icon indicates
that the agent has just changed its status, from 'All OK' to 'we have a problem'.
 When an agent is down or there is no news from it for 2 times the Interval value in seconds. Usually it is due to a communication issue or a crashed remote system.
Alerts: Shows if any alerts have been sent through the following icons:
 No alerts have been sent.
 When at least one alert has been sent within the time threshold of the alert.
Last contact: Shows the time and date of the last data package sent by the agent, using a progress bar, according to value of the interval. If you see the image  , the agent has not send data during the interval. Passing the mouse over the image will show you the last contact in time and date format.
Note: The icon ![]() is only visible if you're and administrator and it's a link to the "Manage Agents" > "Update Agent" option in the Administration menu.
is only visible if you're and administrator and it's a link to the "Manage Agents" > "Update Agent" option in the Administration menu.
When an agent is accessed, by clicking on its name, all the information related to that agent is displayed.
This shows the data introduced when the agent was created and the total number a data packages the agent has sent.
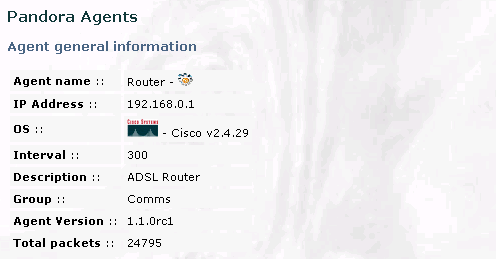
This is the description of all the agent modules been monitored.

In this list the module information is shown in the following columns:
Module name: Name given to the module in the agent's config file.
Module type: Type of module as described in section 3.2.1.
Description: Description given to the module in the agent's config file.
Data: Last data sent by the agent.
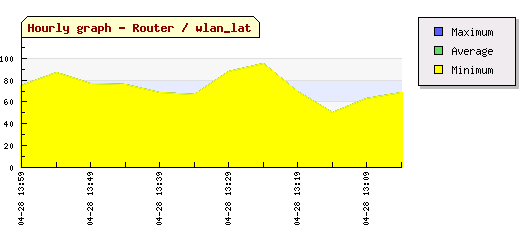
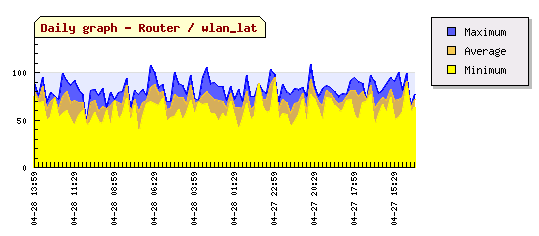
Graph: Monthly(M), Weekly(W), Daily(D) and Hourly(H) graphs are generated with the data sent by the agent against time.
On the left hand side of the graph the newst data is represent, and on the right had side the oldest.
The generated graphs are:
- Hourly graph ( ) covers a 60 minute interval
- Daily graph ( ) covers a 24 hour interval
- Weekly graph ( ) covers a 7 day interval

- Mothly graph ( ) covers a 30 day interval

Raw Data: This is the raw data sent by the agent
-  Last month
-  Last week
-  Last day
This is the description of all the monitors defined by the agent
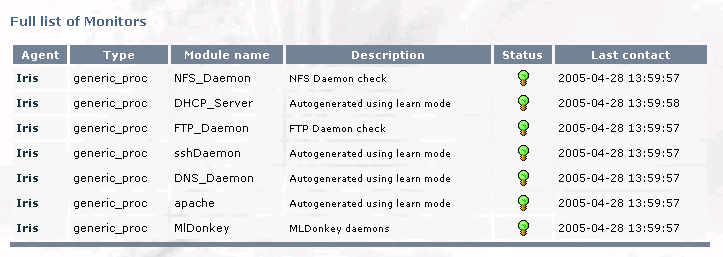
The list shows the information about the monitors in the following columns:
Agent: Agent where the monitor is defined.
Type: Data type of the monitor. For a monitor this value is always of the generic_proc type.
Module name: Name given to the module when it was created.
Description: Description given to the module in the agent's config file.
Status: The table shows the agent status through the following icons:
 The monitor is OK
 The monitor is failing
Last contact: Shows the time and date of the last data packaged received from the agent
This is the description of all the alarms defined in the agent

The monitor information is shown in the list divided in the following fields:
ID: Agent were the alert has been defined.
Type: Type of alert.
Description: Description given to the alert when it was created.
Last fired: The last time the alert was executed.
Times Fired: Number of times the alert was launched.
Status: Shows if the alert has been sent through the following icon:
 No alerts have been sent
 At least one alert has been sent
The groups configured in Pandora can be accessed through "View Agents">"Group detail" in the Operation menu. The group details can be reviewed quikly thanks to a system of coloured bulbs.
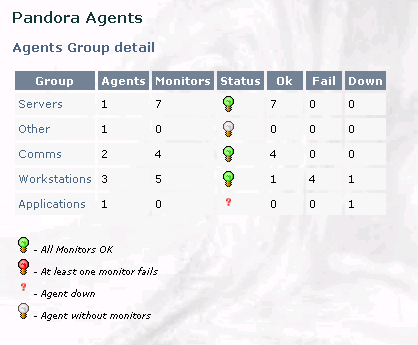
Groups: Name of the group
Agents: Number of agents configured in the group.
Monitors: Number of monitors configured in the group.
Status: The status is described through the following icons:
 All monitors are OK.
 At least one monitor has failed.
 At least one monitor is down and there is no contact with it.
 This Agent doesn't have any monitor defined.
OK: Number of monitors that are OK.
Failed: Number of failing monitors.
Down: Number of down monitors.
The description of all the monitors (a monitor is a module of "proc" type) defined in the server can be viewed from the "View Agents">"Monitor detail" option in the Operation menu.

In this list all the monitors appear in a similar way as in the individual view, but now they are shown all together. This allows a deeper analisys of each monitor.
The description of all the alerts defined in the server can be viewed from the "View Agents">"Alert Details" option in Operation menu.

In this list all the alerts appear in a similar way as in the individual view, but now they are shown all together. This allows a deeper analisys of each alert.
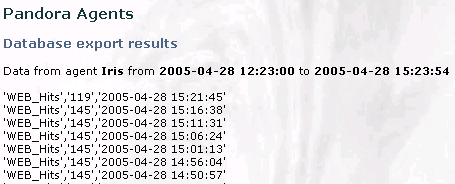
The Data Export tool can be found in the "View Agents">"Export data" option in the Operation Menu.
Three parameters need to be configured for exporting data: the agent where data resides, the modules to be exported and the date interval of the data to be exported:

The fields in the results of Exporting data are:
Module: Module name.
Data: Data contained by the module.
Timestamp: Date and time of the the package was sent by the agent.

Selecting the CSV format for the output, a text file with extension .csv is be created. The data is qualified by single quotes and the fields separated by commas:
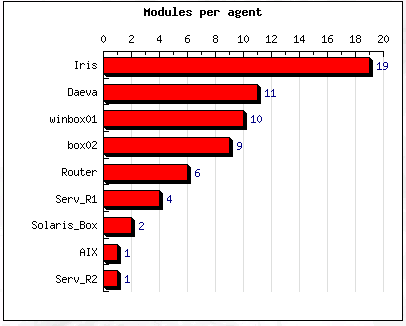
Two kinds of graphical statistics are displayed from the "View Agents">"Statistics" option, in the Operation menu:


Majority of devices can send SNMP traps when have any problem as reboot, lost interface, the temperature is very high, CPU crash, etc. With Traps is possible to know the problem when it happens.
In Pandora FMS 1.3 there is a SNMP console to receive SNMP traps. It is possible configure any device to send SNMP traps to Pandora FMS, you only need the Pandora IP and Community.
From SNMP Console in the Operation menu the users can see the SNMP traps sent to Pandora Server.

Just like is possible to generate an alert if there is an out of range module value. It is possible to generate an alert if an SNMP trap is received with a anorma value. The Alert can consist of sending and e-mail or SMS to the administrator, sending an SNMP trap, write the incident into the system syslog or Pandora log file, etc. Basically anything that can be triggered by a script configured in the Operating System when Pandora Servers run.
In "SNMP Console" > "SNMP Alerts" from Operation menu, the users can see the configured SNMP Alerts.

- To create a new alert the administrator must click in "Create" button. Then you get the following screen:

To assign an Alert the next fields must be filled in:
Alert: This can be selected from the list of alerts that have been previously generated.
Alert type: You can chose between "OID", "Custom OID/value" or "SNNMAgent".
Description: Describes the function of the Alert, and it is useful to identify the Alert amongst the others in the Alert General View.
OID: The OID to be motitorized by the alert.
Custom value: Custom value to be motitorized by the alert.
SNMP Agent IP: IP of the SNMP agent.
Field #1 (Alias, name): Define the used value for the "_field1_" variable.
Field #2 (Single Line): Define the used value for the "_field2_" variable.
Field #3 (Full Text): Define the used value for the "_field3_" variable.
Min number of alerts: Minimum number of alerts that can be sent consecutively.
Max number of alerts: Maximum number of alerts that can be sent consecutively.
Time threshold: Minimum duration between the firing of two consecutive alerts, in seconds.
Pandora FMS is Free Software Project, licensed under GPL terms.
© Sancho Lerena 2003-2006, David villanueva 2004-2006, Alex Arnal 2005, Raúl Mateos 2004-2006.