31 KiB
bottom
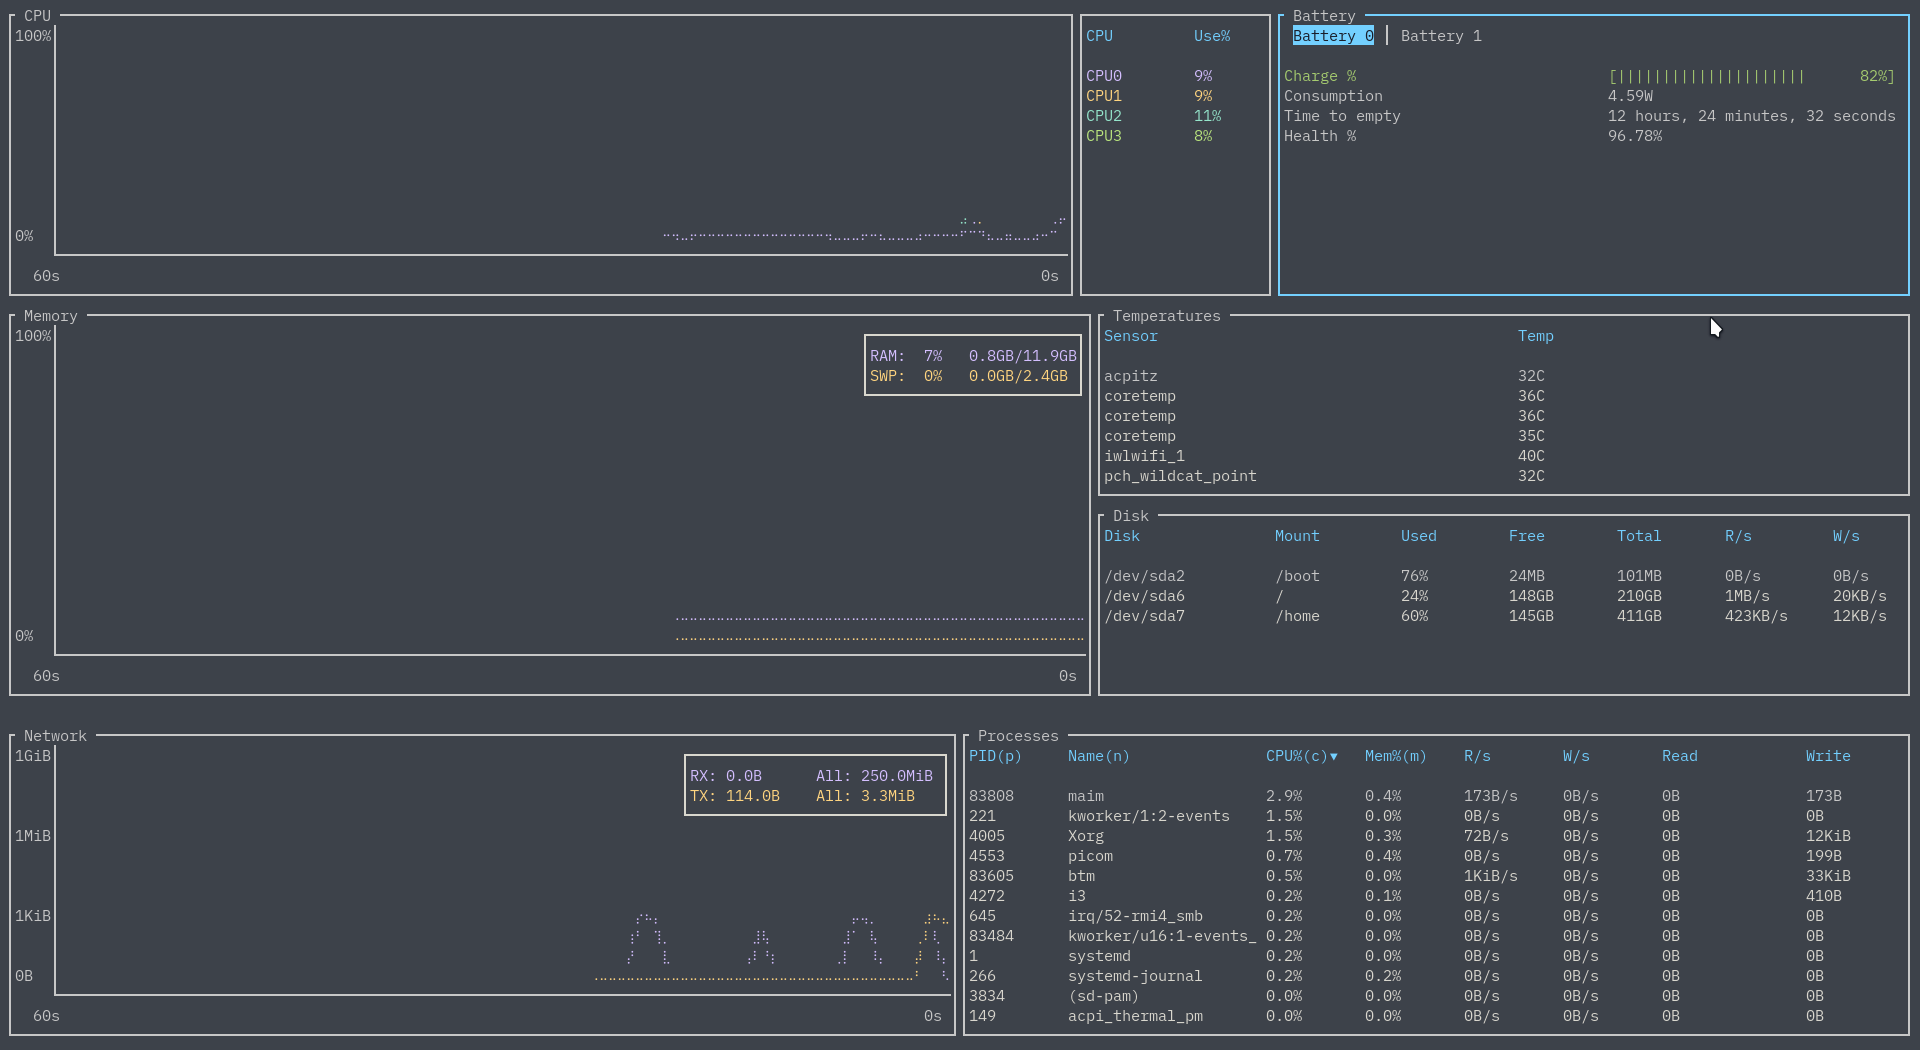
A cross-platform graphical process/system monitor with a customizable interface and a multitude of features. Supports Linux, macOS, and Windows. Inspired by both gtop and gotop.
 Theme based on gruvbox (see sample config). Recorded on version 0.4.0.
Note: If you are reading this on the master branch, then it may refer to in-development or un-released features/changes. Please refer to release branch or crates.io for the most up-to-date release documentation.
Table of Contents
Installation
Note that bottom is:
- Built on the stable version of Rust
- Tested and released for only
x86_64(andi686for Windows) - Developed mainly for macOS, Windows, and Linux
As such, support beyond that is not guaranteed.
Manually
There are a few ways to go about doing this manually. If you do so, please build using the current stable release of Rust. For example:
# If required, update Rust on the stable channel
rustup update stable

# Clone and install the newest master version all via Cargo
cargo install --git https://github.com/ClementTsang/bottom

# Clone from master and install manually
git clone https://github.com/ClementTsang/bottom
cd bottom
cargo install --path .

# Download from releases and install
curl -LO https://github.com/ClementTsang/bottom/releases/download/0.4.5/bottom_source_code.tar.gz
tar -xzvf bottom_source_code.tar.gz
cargo install --path .
Cargo
# If required, update Rust on the stable channel
rustup update stable

cargo install bottom

# OR, --locked may be required due to how cargo install works
cargo install bottom --locked
AUR
yay -S bottom

# If you instead want a pre-built binary:
yay -S bottom-bin
Debian
A .deb file is provided on each release:
curl -LO https://github.com/ClementTsang/bottom/releases/download/0.4.5/bottom_0.4.5_amd64.deb
sudo dpkg -i bottom_0.4.5_amd64.deb
Homebrew
brew tap clementtsang/bottom
brew install bottom

# If you need to be more specific, use:
brew install clementtsang/bottom/bottom
Scoop
scoop install bottom
Chocolatey
Choco package located here.
choco install bottom

# Version number may be required for newer releases, if available:
choco install bottom --version=0.4.5
Usage
Run using btm.
Flags
-h, --help                          Prints help information, including flags and options
-a, --hide_avg_cpu                  Hides the average CPU usage
-m, --dot-marker                    Uses a dot marker instead of the default braille marker
-c, --celsius                       Displays the temperature type in Celsius [default]
-f, --fahrenheit                    Displays the temperature type in Fahrenheit
-k, --kelvin                        Displays the temperature type in Kelvin
-l, --left_legend                   Displays the CPU legend to the left rather than the right
-u, --current_usage                 Sets process CPU usage to be based on current total CPU usage
-g, --group                         Groups together processes with the same name by default
-S, --case_sensitive                Search defaults to matching cases
-W, --whole                         Search defaults to searching for the whole word
-R, --regex                         Search defaults to using regex
-s, --show_disabled_data            Shows disabled CPU entries in the CPU legend
-b, --basic                         Enables basic mode, removing charts and condensing data
    --autohide_time                 Automatically hide the time scaling in graphs after being shown for a brief moment when
                                    zoomed in/out.  If time is disabled via --hide_time then this will have no effect
    --use_old_network_legend        Use the older (pre-0.4) network legend which is separate from the network chart
    --hide_table_gap                Hides the spacing between table headers and data
    --battery                       Displays the battery widget for default and basic layouts
Options
-r, --rate <MS>                     Set the refresh rate in milliseconds [default: 1000]
-C, --config <PATH>                 Use the specified config file; if it does not exist it is automatically created [default: see section on config files]
-t, --default_time_value <MS>       Sets the default time interval for charts in milliseconds [default: 60000]
-d, --time_delta <MS>               Sets the default amount each zoom in/out action changes by in milliseconds [default: 15000]
    --default_widget_count <COUNT>  Which number of the selected widget type to select, from left to right, top to bottom [default: 1]
    --default_widget_type <TYPE>    The default widget type to select by default [default: "process"]
Keybindings
General
q, Ctrl-c |
Quit |
Esc |
Close dialog windows, search, widgets, or exit expanded mode |
Ctrl-r |
Reset display and any collected data |
f |
Freeze/unfreeze updating with new data |
Ctrl-LeftShift-LeftHA |
Move widget selection left |
Ctrl-RightShift-RightLD |
Move widget selection right |
Ctrl-UpShift-UpKW |
Move widget selection up |
Ctrl-DownShift-DownJS |
Move widget selection down |
Left, h |
Move left within widget |
Down, j |
Move down within widget |
Up,k |
Move up within widget |
Right, l |
Move right within widget |
? |
Open help menu |
gg, Home |
Jump to the first entry |
Shift-g, End |
Jump to the last entry |
e |
Toggle expanding the currently selected widget |
+ |
Zoom in on chart (decrease time range) |
- |
Zoom out on chart (increase time range) |
= |
Reset zoom |
| Mouse scroll | Table: Scroll Chart: Zooms in or out by scrolling up or down respectively |
CPU bindings
| Mouse scroll | Scrolling over an CPU core/average shows only that entry on the chart |
Process bindings
dd |
Kill the selected process |
c |
Sort by CPU usage, press again to reverse sorting order |
m |
Sort by memory usage, press again to reverse sorting order |
p |
Sort by PID name, press again to reverse sorting order |
n |
Sort by process name, press again to reverse sorting order |
Tab |
Group/un-group processes with the same name |
Ctrl-f, / |
Open process search widget |
P |
Toggle between showing the full path or just the process name |
s, F6 |
Open process sort widget |
I |
Invert current sort |
% |
Toggle between values and percentages for memory usage |
Process search bindings
Tab |
Toggle between searching by PID or name |
Esc |
Close the search widget (retains the filter) |
Ctrl-a |
Skip to the start of the search query |
Ctrl-e |
Skip to the end of the search query |
Ctrl-u |
Clear the current search query |
Backspace |
Delete the character behind the cursor |
Delete |
Delete the character at the cursor |
Alt-c/F1 |
Toggle matching case |
Alt-w/F2 |
Toggle matching the entire word |
Alt-r/F3 |
Toggle using regex |
Left |
Move cursor left |
Right |
Move cursor right |
Process sort bindings
Down, j |
Scroll down in list |
Up, k |
Scroll up in list |
Mouse scroll |
Scroll through sort widget |
Esc |
Close the sort widget |
Enter |
Sort by current selected column |
Battery bindings
Left, Alt-h |
Go to the next battery |
Right, Alt-l |
Go to the previous battery |
Basic memory bindings
% |
Toggle between values and percentages for memory usage |
Process searching keywords
- None of the keywords are case sensitive.
- Use brackets to logically group together parts of the search.
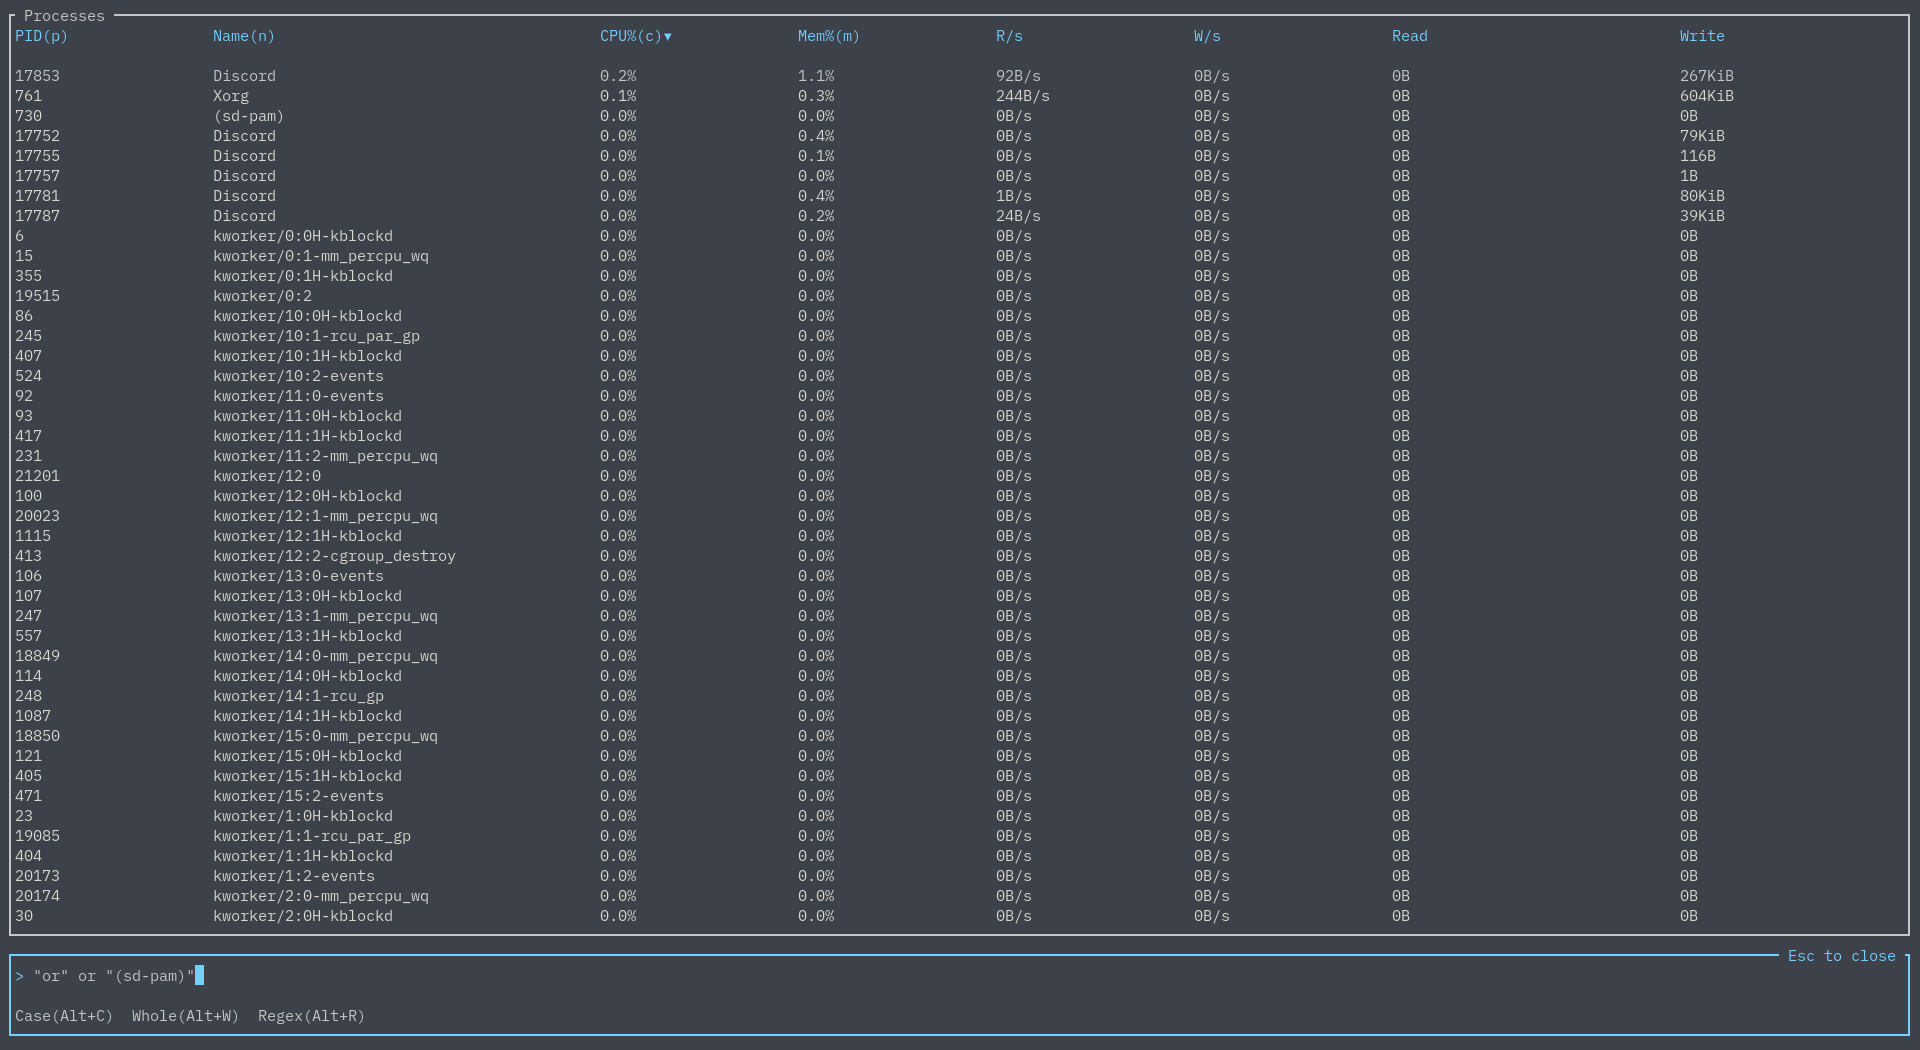
- Furthermore, if you want to search a reserved keyword, surround the text in quotes - for example,
"or" or "(sd-pam)"would be a valid search:
Supported search types
| Keywords | Example | Description |
|---|---|---|
btm |
Matches by process or command name; supports regex | |
pid |
pid=1044 |
Matches by PID; supports regex |
cpu, cpu% |
cpu > 0.5 |
Matches the CPU column; supports comparison operators |
memb |
memb > 1000 b |
Matches the memory column in terms of bytes; supports comparison operators |
mem, mem% |
mem < 0.5 |
Matches the memory column in terms of percent; supports comparison operators |
read, r/s |
read = 1 mb |
Matches the read/s column in terms of bytes; supports comparison operators |
write, w/s |
write >= 1 kb |
Matches the write/s column in terms of bytes; supports comparison operators |
tread, t.read |
tread <= 1024 gb |
Matches he total read column in terms of bytes; supports comparison operators |
twrite, t.write |
twrite > 1024 tb |
Matches the total write column in terms of bytes; supports comparison operators |
state |
state=running |
Matches by state; supports regex |
Supported comparison operators
| Keywords | Description |
|---|---|
= |
Checks if the values are equal |
> |
Checks if the left value is strictly greater than the right |
< |
Checks if the left value is strictly less than the right |
>= |
Checks if the left value is greater than or equal to the right |
<= |
Checks if the left value is less than or equal to the right |
Supported logical operators
Note that the and operator takes precedence over the or operator.
| Keywords | Usage | Description |
|---|---|---|
and, &&, <Space> |
<CONDITION 1> and/&&/<Space> <CONDITION 2> |
Requires both conditions to be true to match |
or, || |
<CONDITION 1> or/|| <CONDITION 2> |
Requires at least one condition to be true to match |
Supported units
| Keywords | Description |
|---|---|
B |
Bytes |
KB |
Kilobytes |
MB |
Megabytes |
GB |
Gigabytes |
TB |
Terabytes |
KiB |
Kibibytes |
MiB |
Mebibytes |
GiB |
Gibibytes |
TiB |
Tebibytes |
Other syntax
| Keywords | Usage | Description |
|---|---|---|
() |
(<CONDITION 1> AND <CONDITION 2>) OR <CONDITION 3> |
Group together a condition |
Features
As yet another process/system visualization and management application, bottom supports the typical features:
-
CPU, memory, and network usage visualization
-
Display information about disk capacity and I/O per second
-
Display temperatures from sensors
-
Display information regarding processes, like CPU, memory, I/O usage, and process state
-
Process management (process killing is all you need, right?)
It also aims to be:
-
Lightweight
-
Cross-platform - supports Linux, Windows, and macOS
In addition, bottom also currently has the following features:
Process searching
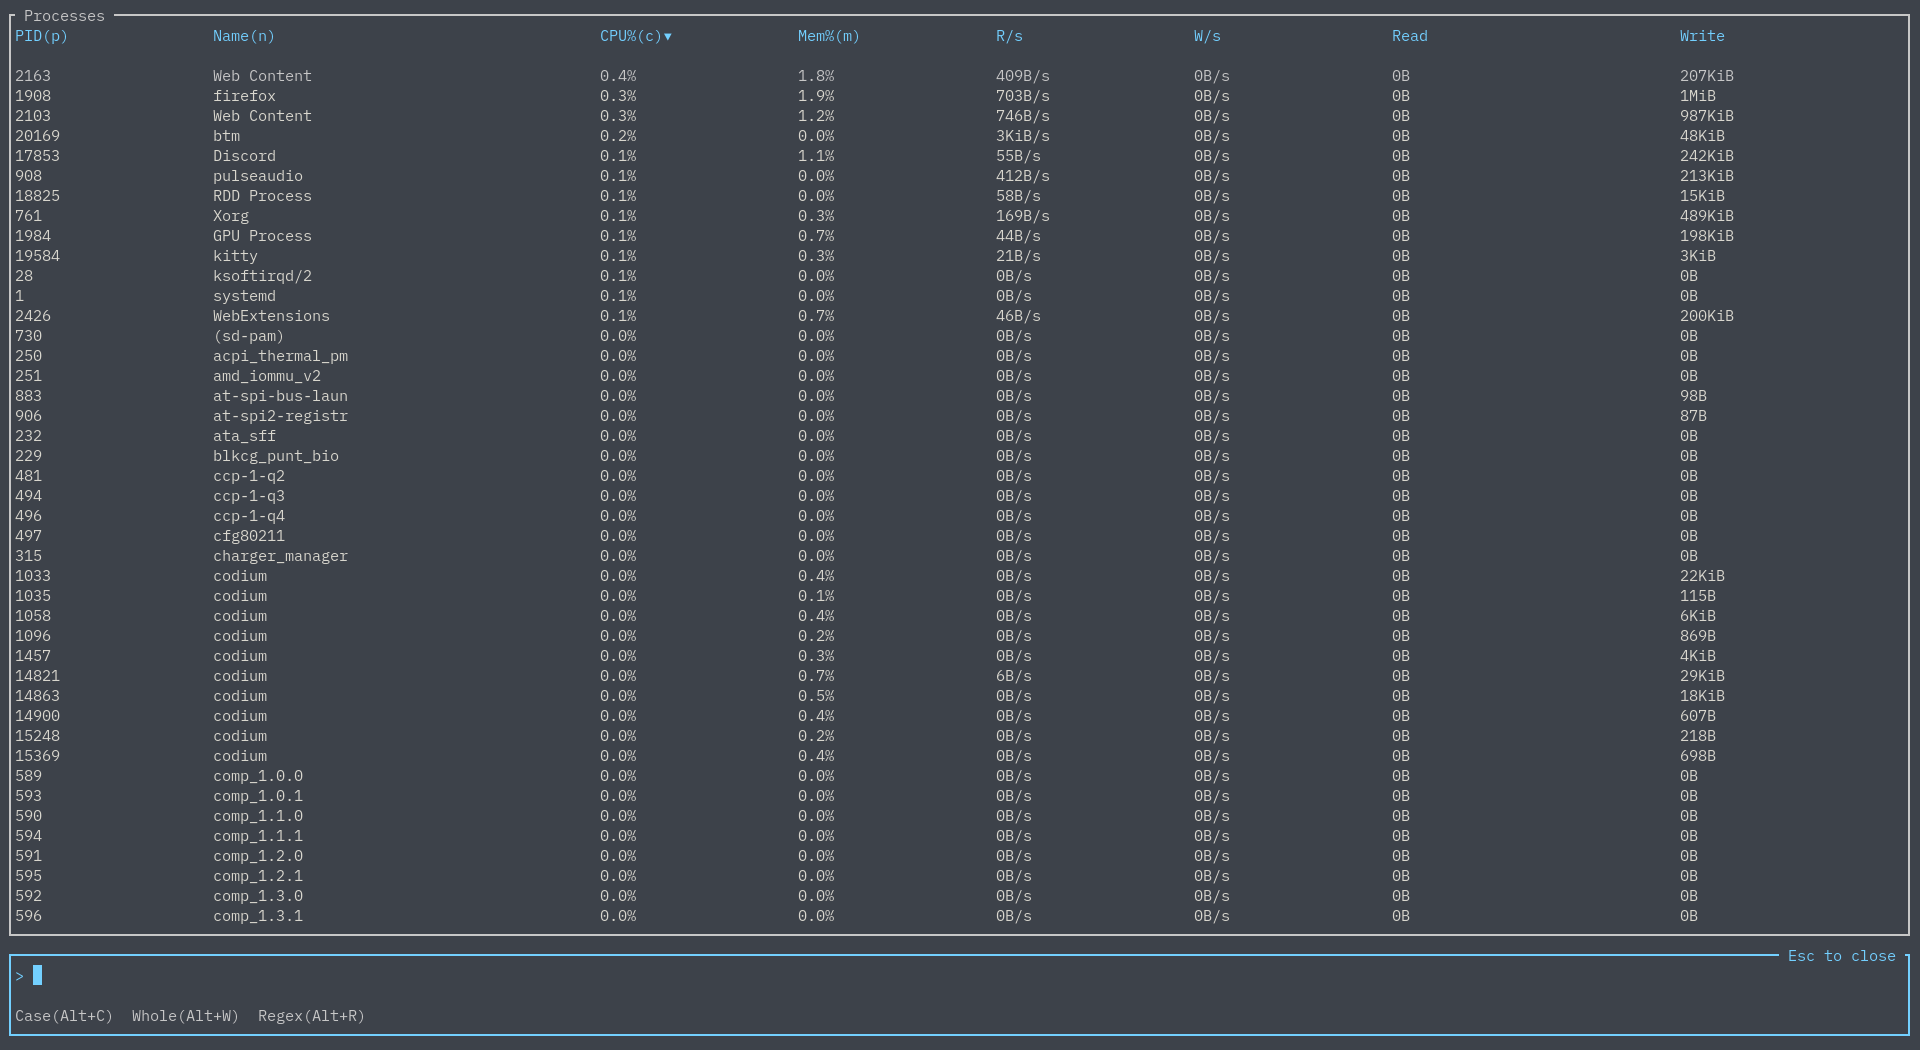
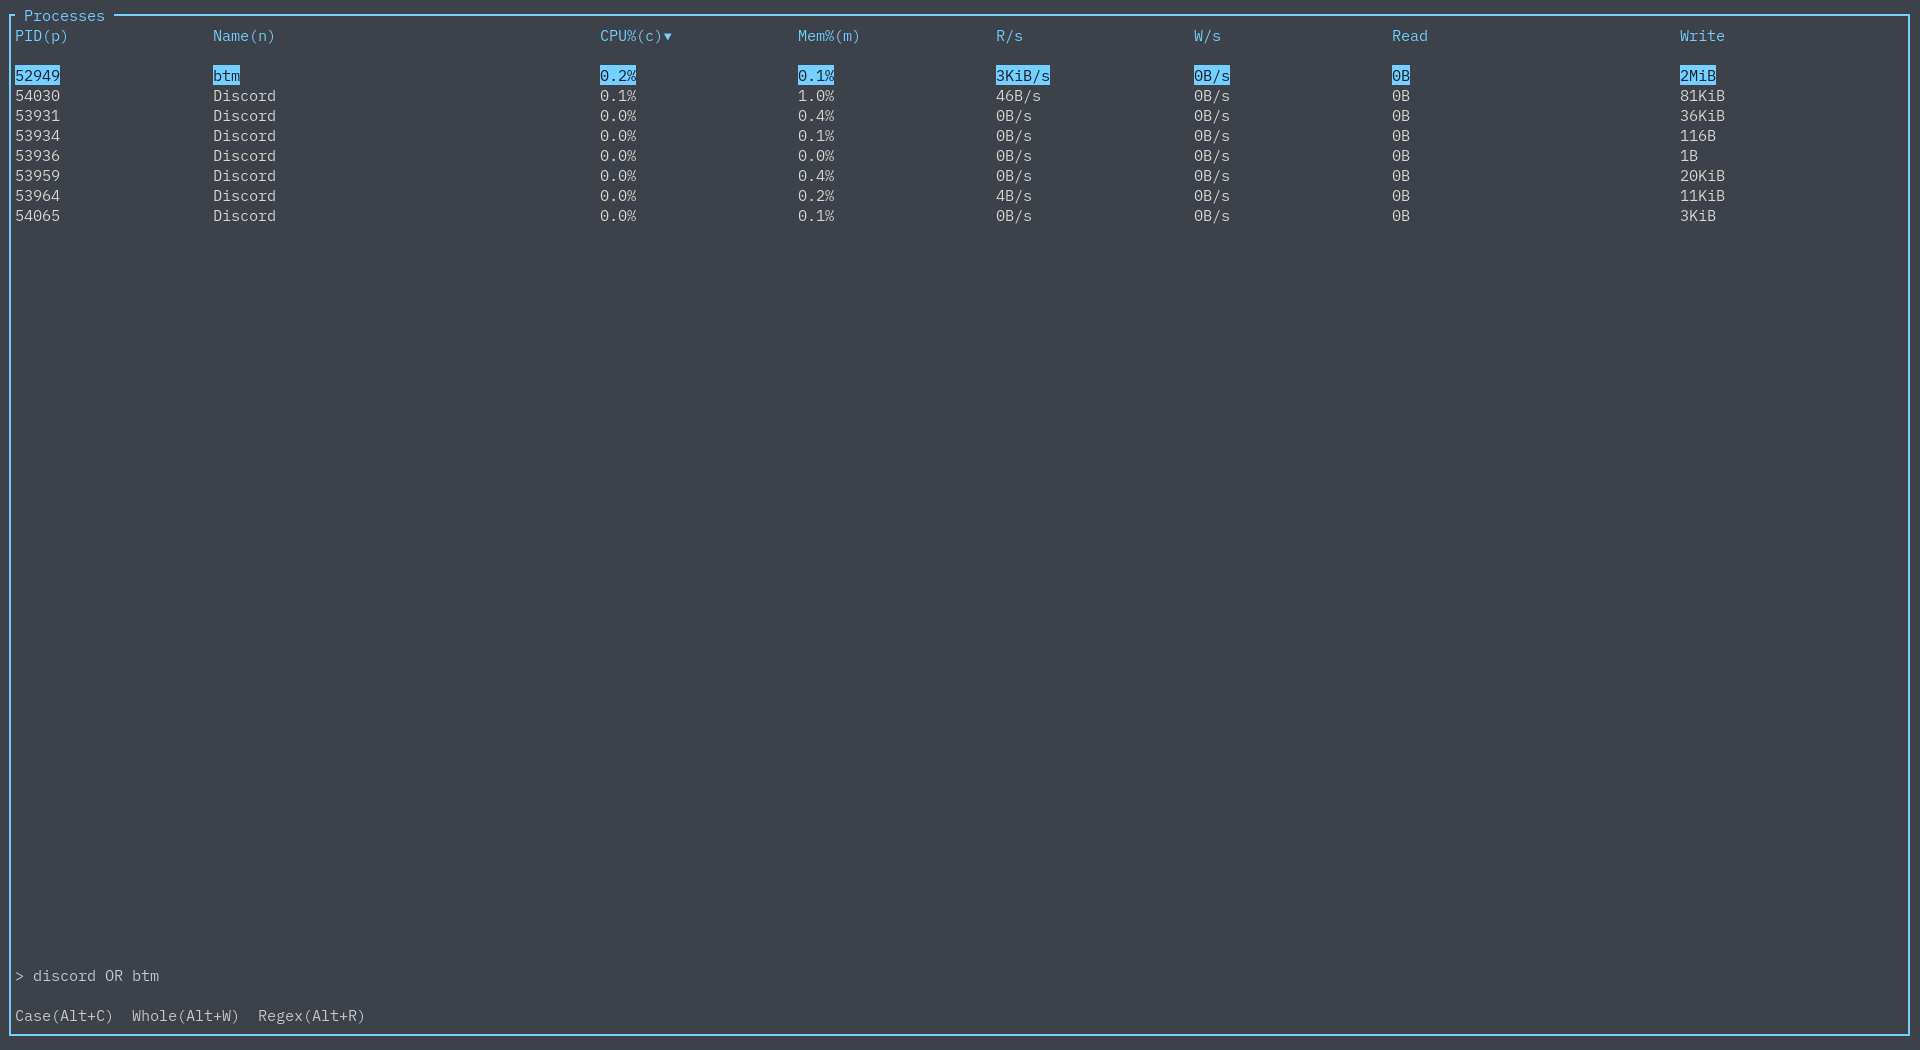
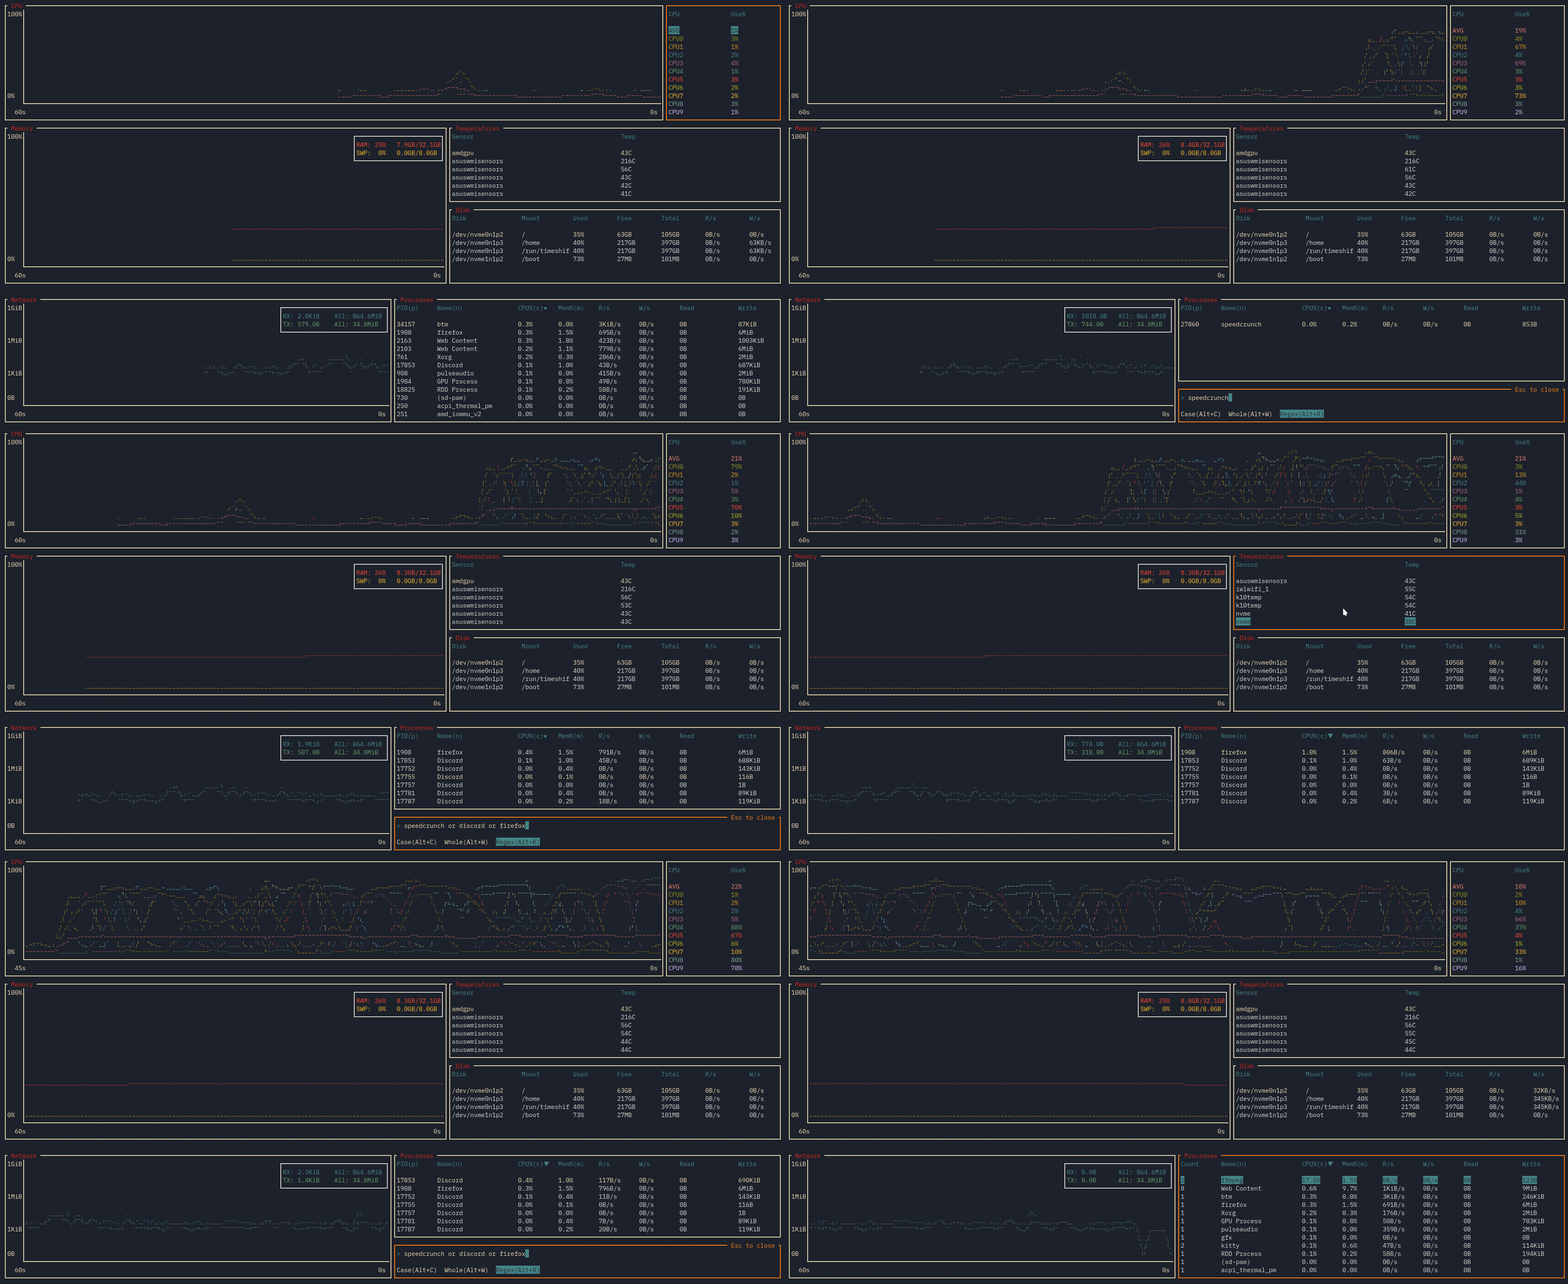
On any process widget, hit / to bring up a search bar. If the layout has multiple process widgets, note this search is independent of other widgets.
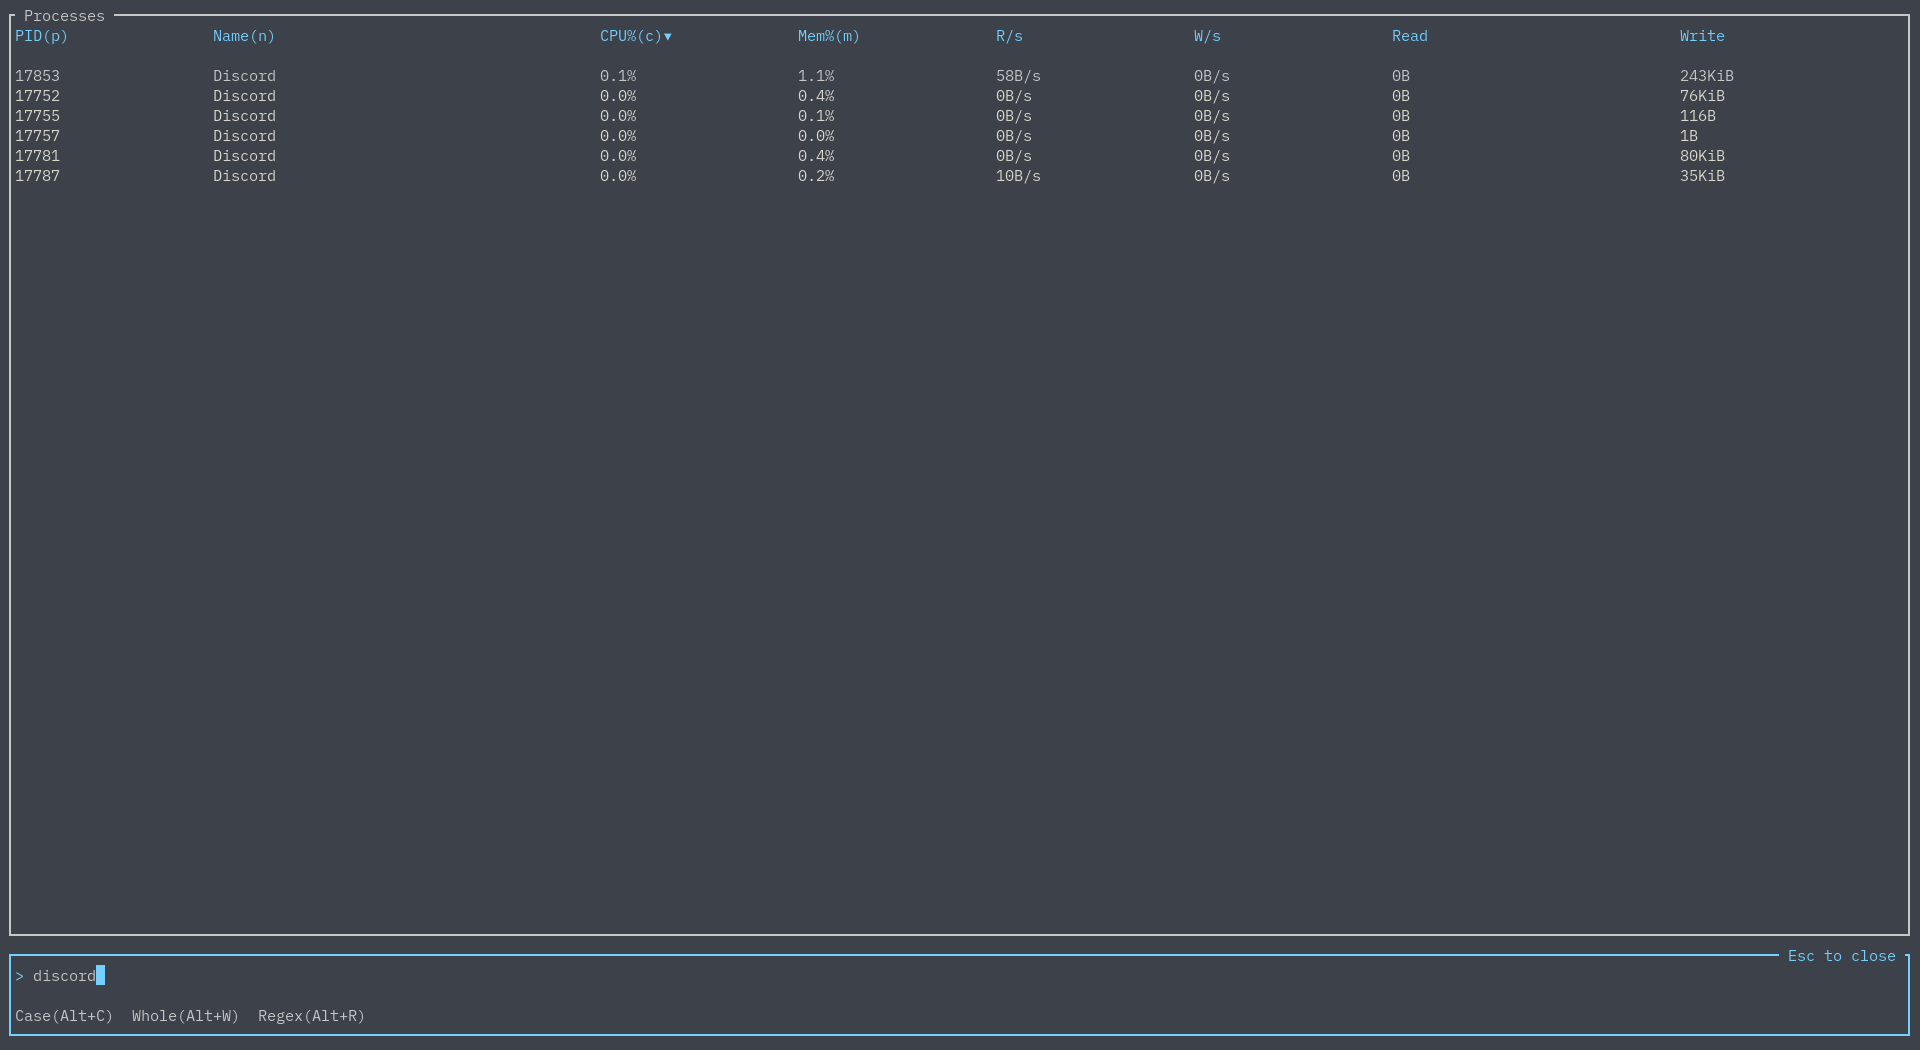
By default, just typing in something will search by process name:
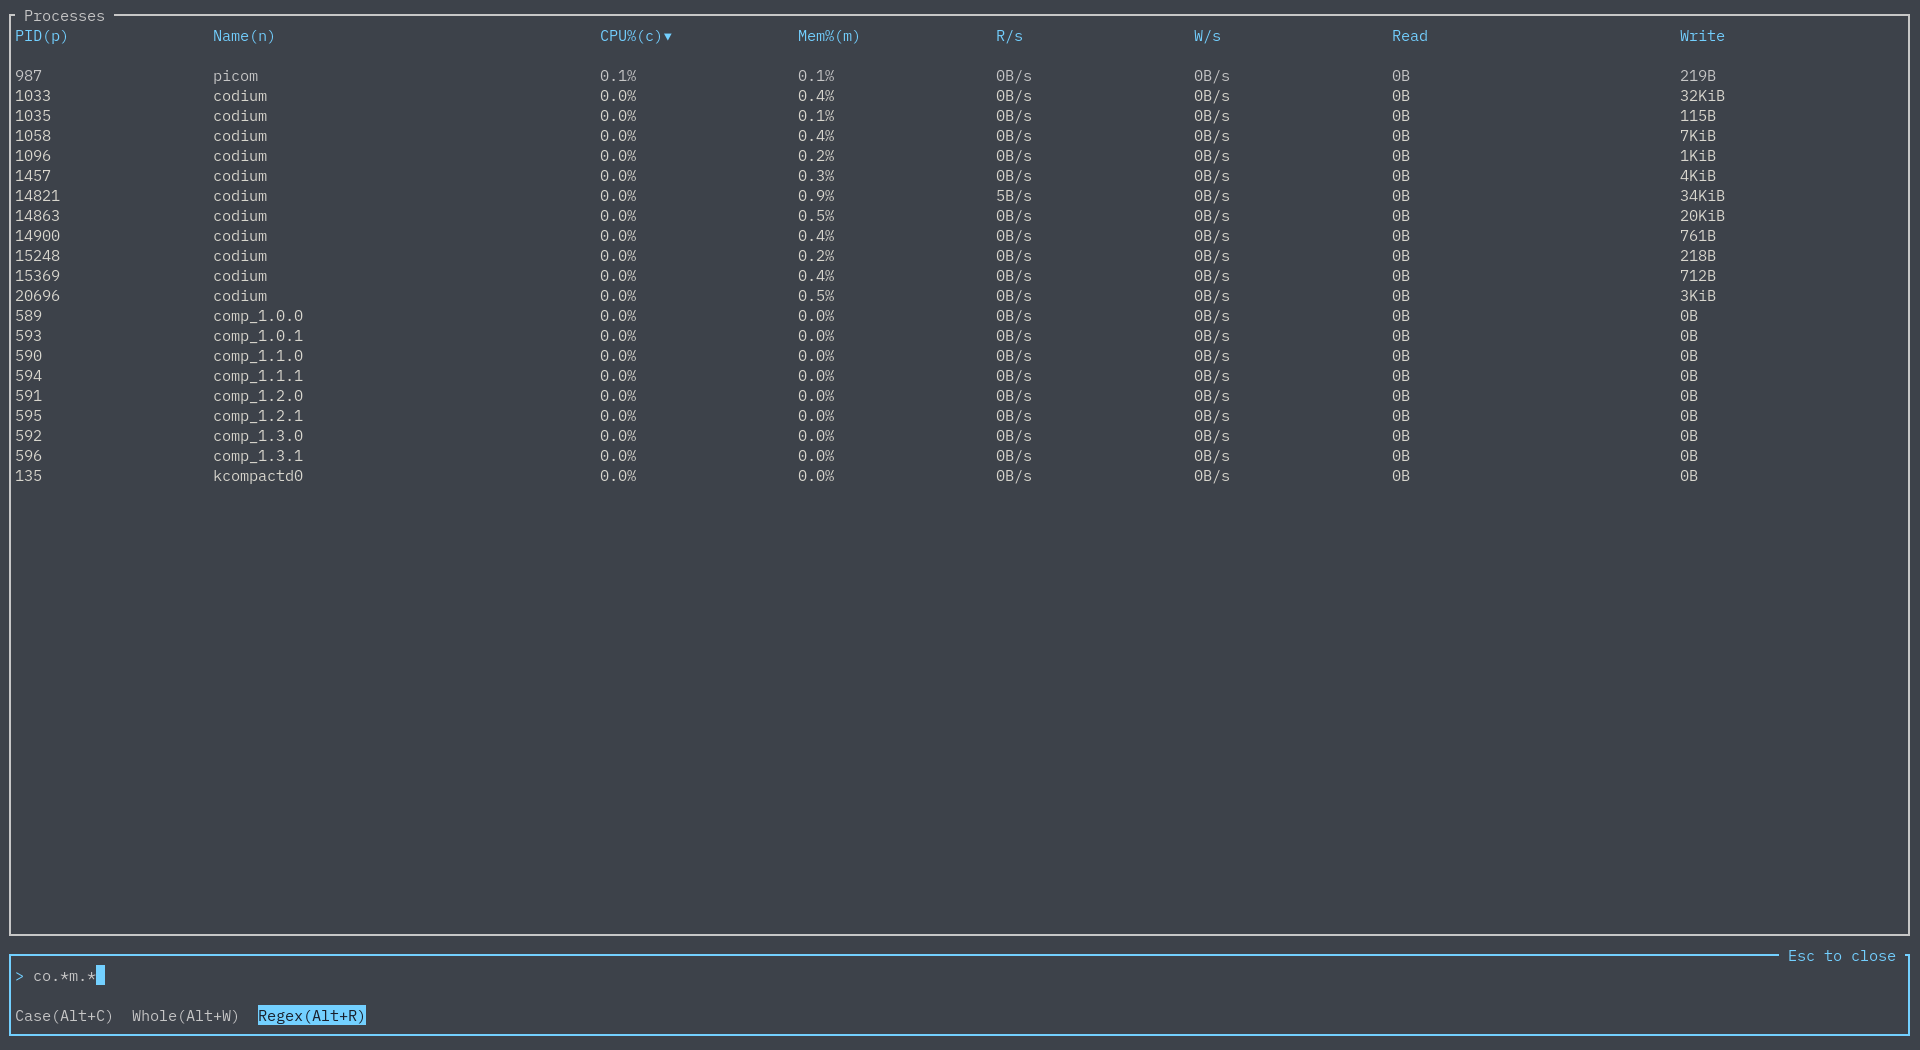
This simple search can be refined by matching by case, matching the entire word, or by using regex:
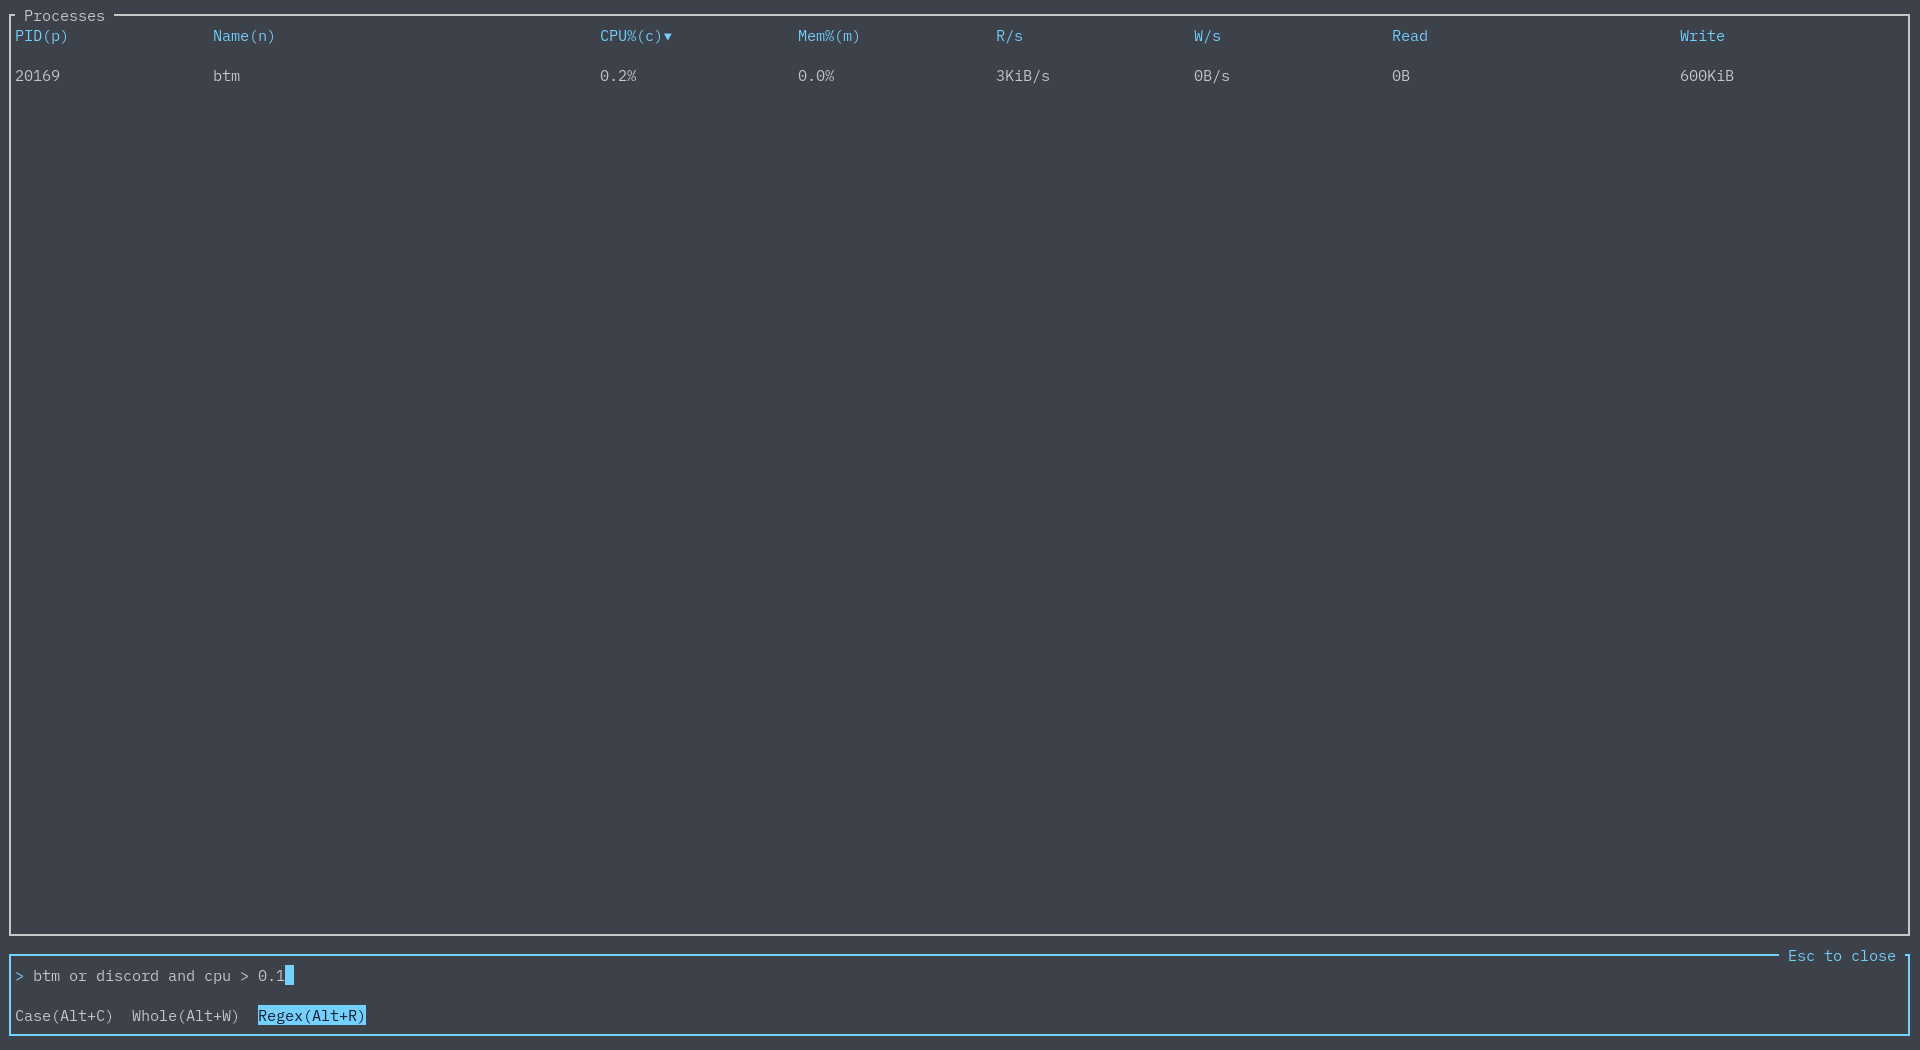
Now let's say you want to search for two things - luckily, we have the AND and OR logical operators:
Furthermore, one is able to refine their searches by CPU usage, memory usage, PID, and more. For example:
One can see all available keywords and query options here.
Zoom
Using the +/- keys or the scroll wheel will move the current time intervals of the currently selected widget, and = to reset the zoom levels to the default.
Widgets can hold different time intervals independently. These time intervals can be adjusted using the
-t/--default_time_value and -d/--time_delta options, or their corresponding config options.
Expand
Only care about one specific widget? You can go to that widget and hit e to make that widget expand and take
up the entire drawing area.
Basic mode
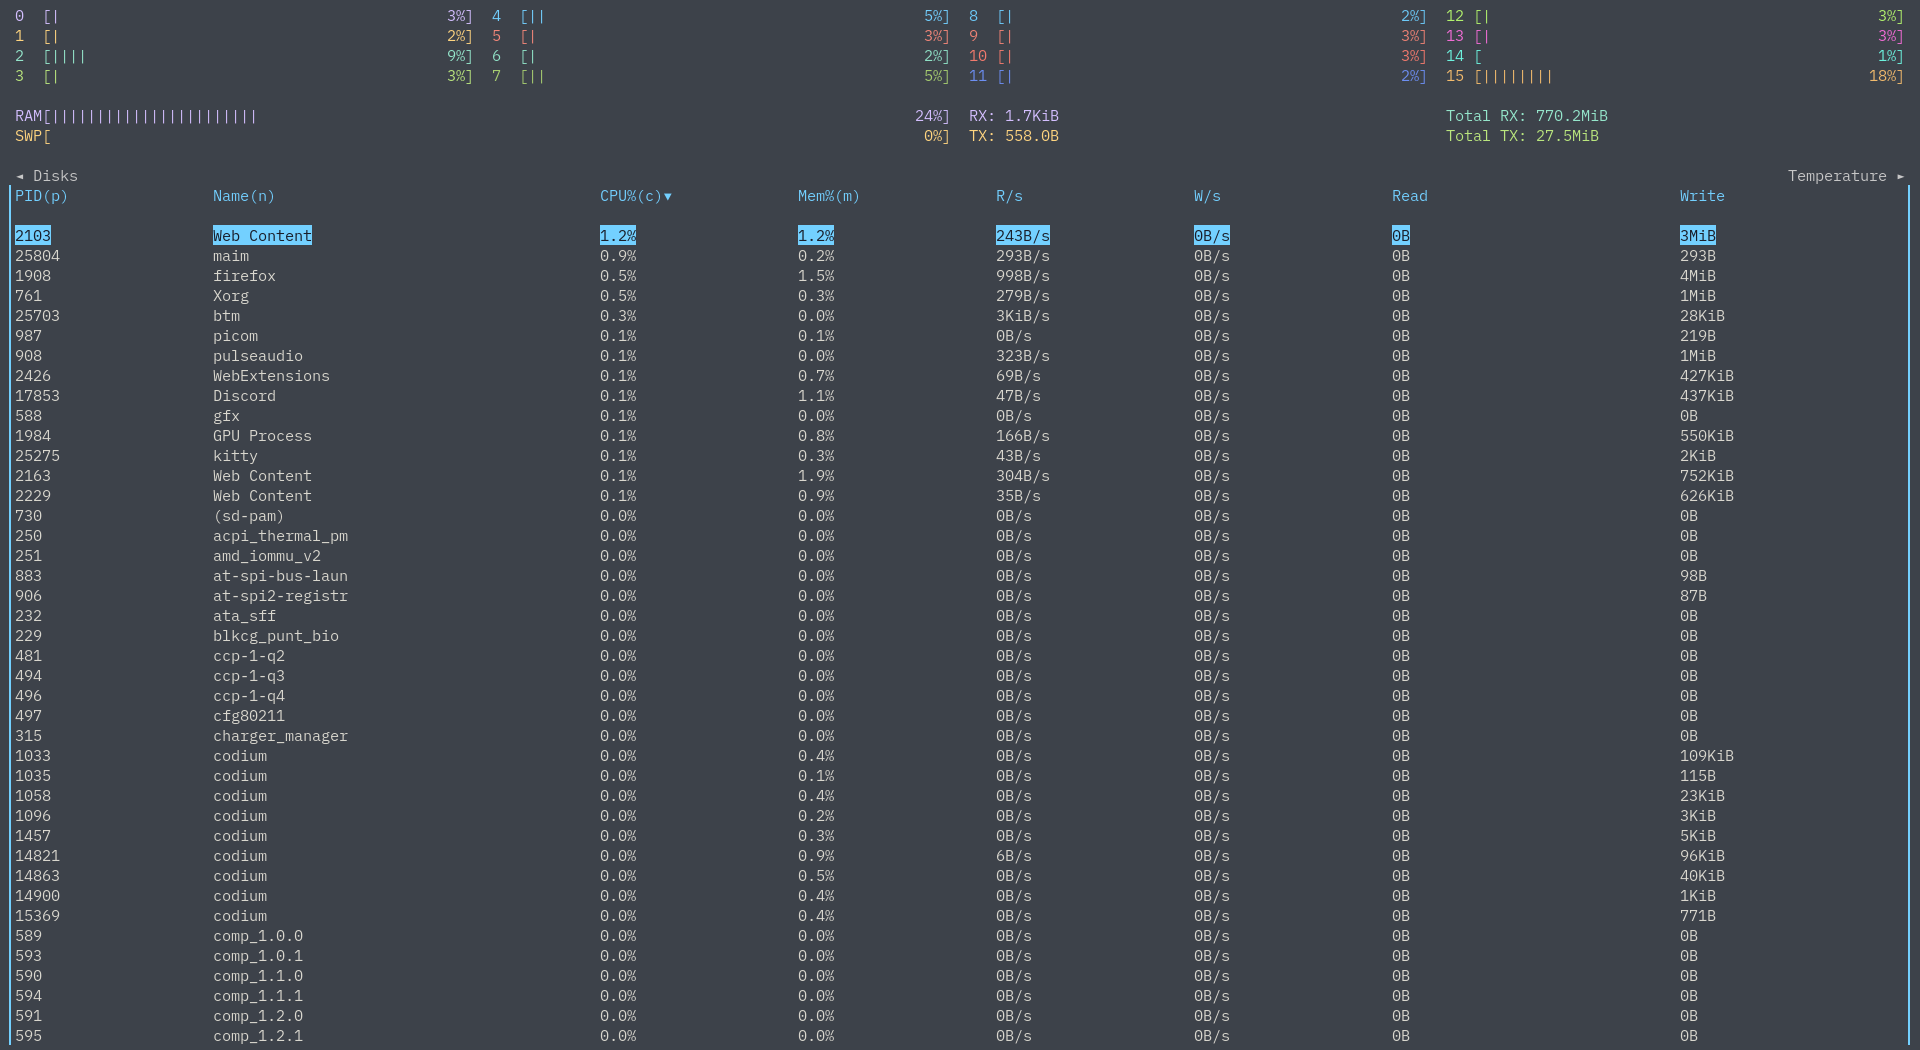
Using the -b or --basic_mode (or their corresponding config options) will open bottom in basic mode.
There are no charts or expanded mode when using this, and tables are condensed such that only one table is displayed
at a time.
Note custom layouts are currently not available when this is used.
Config files
bottom supports reading from a config file to customize its behaviour and look. By default, bottom will look at (based on dirs):
| OS | Location |
|---|---|
~/.config/bottom/bottom.toml or $XDG_CONFIG_HOME/bottom/bottom.toml |
Linux |
$HOME/Library/Application Support/bottom/bottom.toml |
macOS |
C:\Users\<USER>\AppData\Roaming\bottom\bottom.toml |
Windows |
Note that if a config file does not exist at either the default location or the passed in location via -C or --config, one is automatically created with no settings applied.
Config flags
The following options can be set under [flags] to achieve the same effect as passing in a flag on runtime. Note that if a flag is given, it will override the config file.
These are the following supported flag config values:
| Field | Type |
|---|---|
hide_avg_cpu |
Boolean |
dot_marker |
Boolean |
left_legend |
Boolean |
current_usage |
Boolean |
group_processes |
Boolean |
case_sensitive |
Boolean |
whole_word |
Boolean |
regex |
Boolean |
show_disabled_data |
Boolean |
basic |
Boolean |
hide_table_count |
Boolean |
use_old_network_legend |
Boolean |
battery |
Boolean |
rate |
Unsigned Int (represents milliseconds) |
default_time_value |
Unsigned Int (represents milliseconds) |
time_delta |
Unsigned Int (represents milliseconds) |
temperature_type |
String (one of ["k", "f", "c", "kelvin", "fahrenheit", "celsius"]) |
default_widget_type |
String (one of ["cpu", "proc", "net", "temp", "mem", "disk"], same as layout options) |
default_widget_count |
Unsigned Int (represents which default_widget_type) |
Theming
The config file can be used to set custom colours for parts of the application under the [colors] object. The following labels are customizable with strings that are hex colours, RGB colours, or specific named colours.
Supported named colours are one of the following strings: Reset, Black, Red, Green, Yellow, Blue, Magenta, Cyan, Gray, DarkGray, LightRed, LightGreen, LightYellow, LightBlue, LightMagenta, LightCyan, White.
| Labels | Details | Example |
|---|---|---|
| Table header colours | Colour of table headers | table_header_color="255, 255, 255" |
| CPU colour per core | Colour of each core. Read in order. | cpu_core_colors=["#ffffff", "white", "255, 255, 255"] |
| Average CPU colour | The average CPU color | avg_cpu_color="White" |
| All CPUs colour | The colour for the "All" CPU label | all_cpu_color="White" |
| RAM | The colour RAM will use | ram_color="#ffffff" |
| SWAP | The colour SWAP will use | swap_color="#ffffff" |
| RX | The colour rx will use | rx_color="#ffffff" |
| TX | The colour tx will use | tx_color="#ffffff" |
| Widget title colour | The colour of the label each widget has | widget_title_color="#ffffff" |
| Border colour | The colour of the border of unselected widgets | border_color="#ffffff" |
| Selected border colour | The colour of the border of selected widgets | highlighted_border_color="#ffffff" |
| Text colour | The colour of most text | text_color="#ffffff" |
| Graph colour | The colour of the lines and text of the graph | graph_color="#ffffff" |
| Cursor colour | The cursor's colour | cursor_color="#ffffff" |
| Selected text colour | The colour of text that is selected | scroll_entry_text_color="#ffffff" |
| Selected text background colour | The background colour of text that is selected | scroll_entry_bg_color="#ffffff" |
| Battery bar colours | Colour used is based on percentage and no. of colours | battery_colours=["green", "yellow", "red"] |
Layout
bottom supports customizable layouts via the config file. Currently, layouts are controlled by using TOML objects and arrays.
For example, given the sample layout:
[[row]]
  [[row.child]]
  type="cpu"
[[row]]
    ratio=2
    [[row.child]]
      ratio=4
      type="mem"
    [[row.child]]
      ratio=3
      [[row.child.child]]
        type="temp"
      [[row.child.child]]
        type="disk"
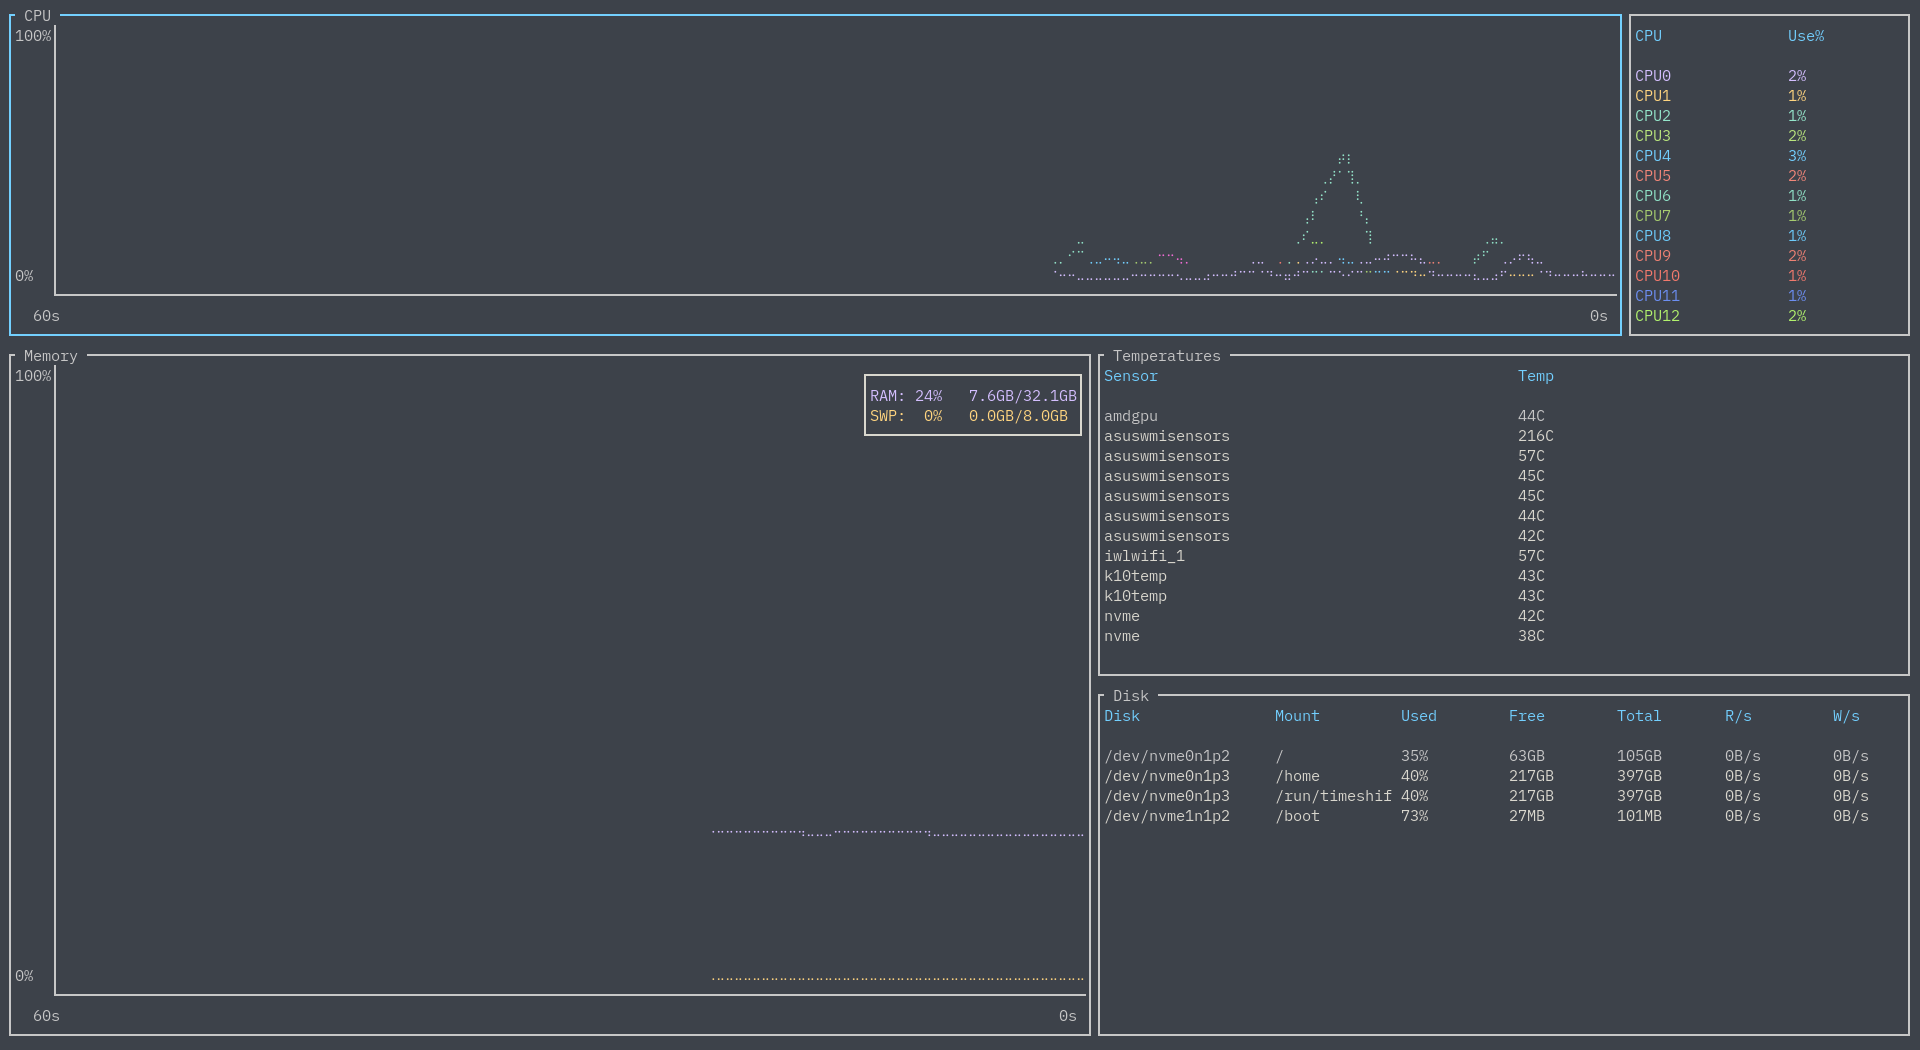
This would give a layout that has two rows, with a 1:2 ratio. The first row has only the CPU widget. The second row is split into two columns with a 4:3 ratio. The first column contains the memory widget. The second column is split into two rows with a 1:1 ratio. The first is the temperature widget, the second is the disk widget.
This is what the layout would look like when run:
Each [[row]] represents a row in the layout. A row can have any number of child values. Each [[row.child]]
represents either a column or a widget. A column can have any number of child values as well. Each [[row.child.child]]
represents a widget. A widget is represented by having a type field set to a string.
The following type values are supported:
"cpu" |
CPU chart and legend |
"mem", "memory" |
Memory chart |
"net", "network" |
Network chart and legend |
"proc", "process", "processes" |
Process table and search |
"temp", "temperature" |
Temperature table |
"disk" |
Disk table |
"empty" |
An empty space |
"batt", "battery" |
Battery statistics |
Each component of the layout accepts a ratio value. If this is not set, it defaults to 1.
For an example, look at the default config, which contains the default layout.
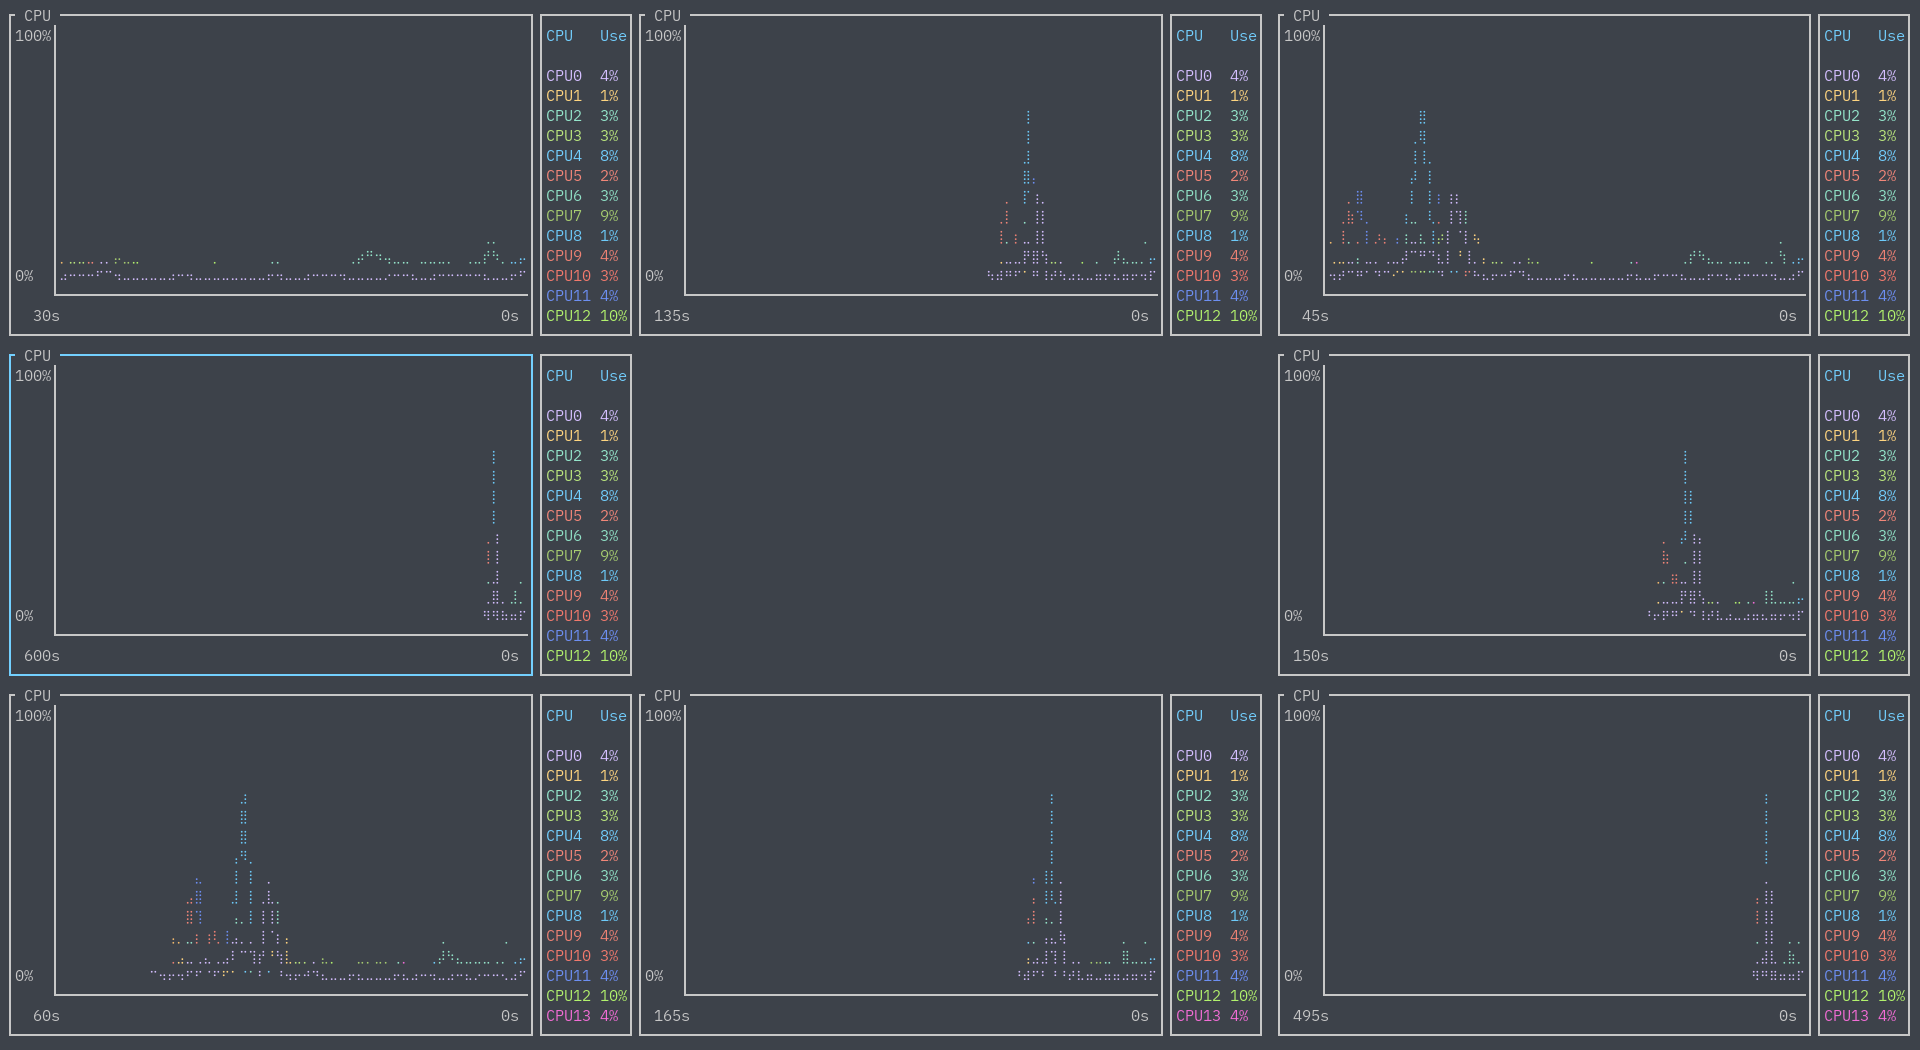
And if your heart desires, you can have duplicate widgets. This means you could do something like:
[[row]]
  ratio=1
  [[row.child]]
  type="cpu"
  [[row.child]]
  type="cpu"
  [[row.child]]
  type="cpu"
[[row]]
  ratio=1
  [[row.child]]
  type="cpu"
  [[row.child]]
  type="empty"
  [[row.child]]
  type="cpu"
[[row]]
  ratio=1
  [[row.child]]
  type="cpu"
  [[row.child]]
  type="cpu"
  [[row.child]]
  type="cpu"
and get the following CPU donut:
Battery
You can get battery statistics (charge, time to fill/discharge, consumption in watts, and battery health) via the battery widget.
Since this is only useful for devices like laptops, it is off by default. You can either enable the widget in the default layout via the --battery flag, or by specifying the widget in a layout:
Compatibility
The current compatibility of widgets with operating systems from personal testing:
| OS | CPU | Memory | Disks | Temperature | Processes/Search | Networks | Battery |
|---|---|---|---|---|---|---|---|
| Linux | ✓ | ✓ | ✓ | ✓ | ✓ | ✓ | ✓ |
| Windows | ✓ | ✓ | ✓ | ✗ | ✓ | ✓ | ✓ (seems to have issues with dual batteries) |
| macOS | ✓ | ✓ | ✓ | ✓ | ✓ | ✓ | ✓ |
Contribution
Contribution is always welcome! Please take a look at CONTRIBUTING.md for details on how to help.
Contributors
Thanks to all contributors (emoji key):
Marcin Wojnarowski 💻 📦 |
Mahmoud Al-Qudsi 💻 |
Andy 💻 |
Kim Brose 💻 |
Sven-Hendrik Haase 📖 |
Thanks
-
This project is very much inspired by both gotop, its successor ytop, and gtop.
-
Basic mode is heavily inspired by htop's design.
-
This application was written with many, many libraries, and built on the work of many talented people. This application would be impossible without their work.
-
And of course, thanks to all contributors!

